

Endothelin-1 is a transcriptional target of p53 in epidermal keratinocytes and regulates ultraviolet-induced melanocyte homeostasis
- PMID: 23279852
- PMCID: PMC3663331
- DOI: 10.1111/pcmr.12063
Endothelin-1 is a transcriptional target of p53 in epidermal keratinocytes and regulates ultraviolet-induced melanocyte homeostasis
Abstract
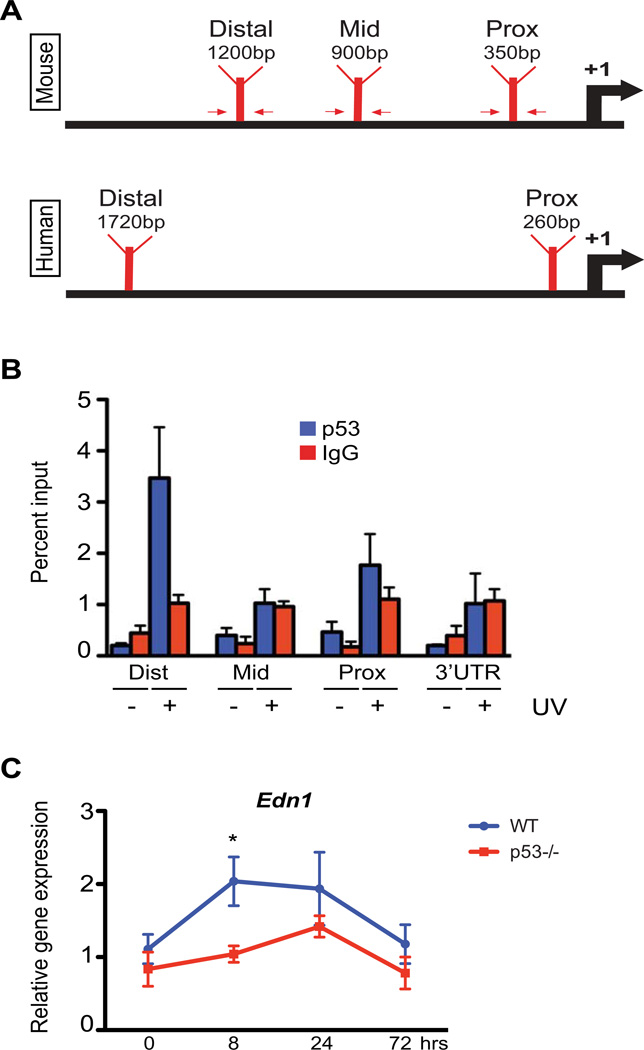
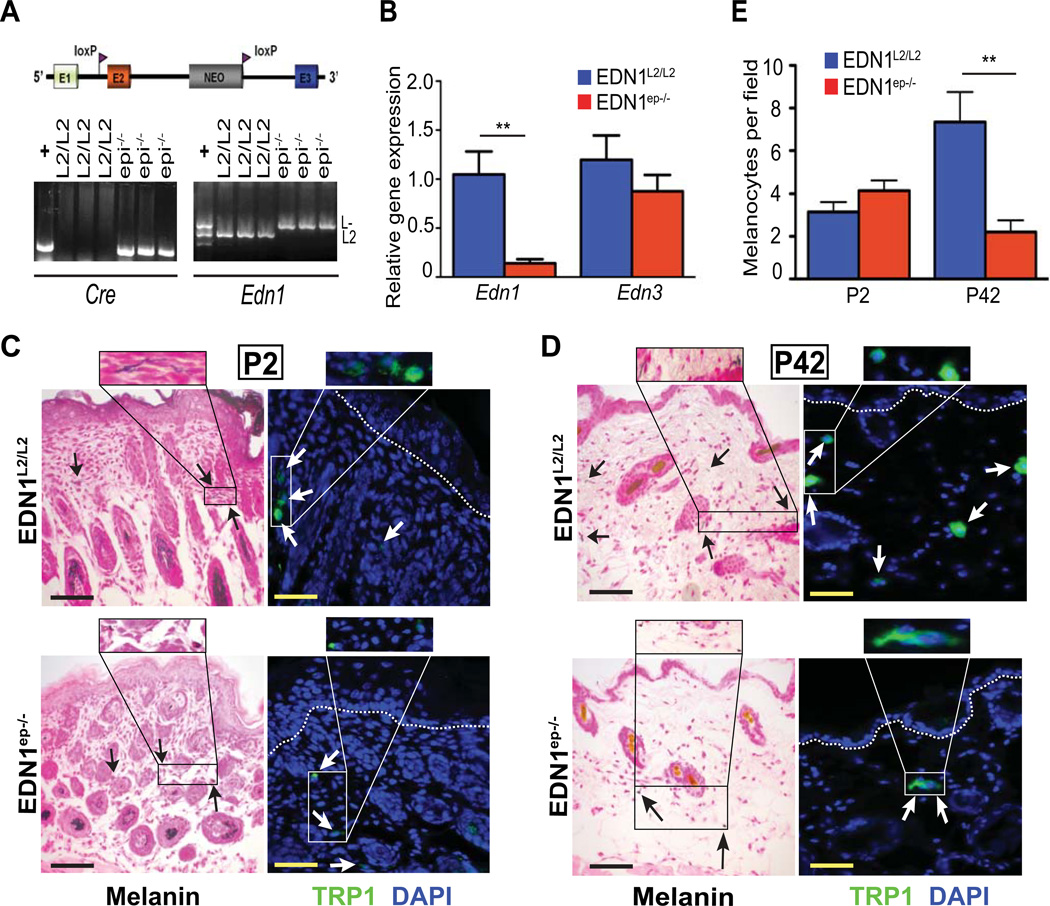
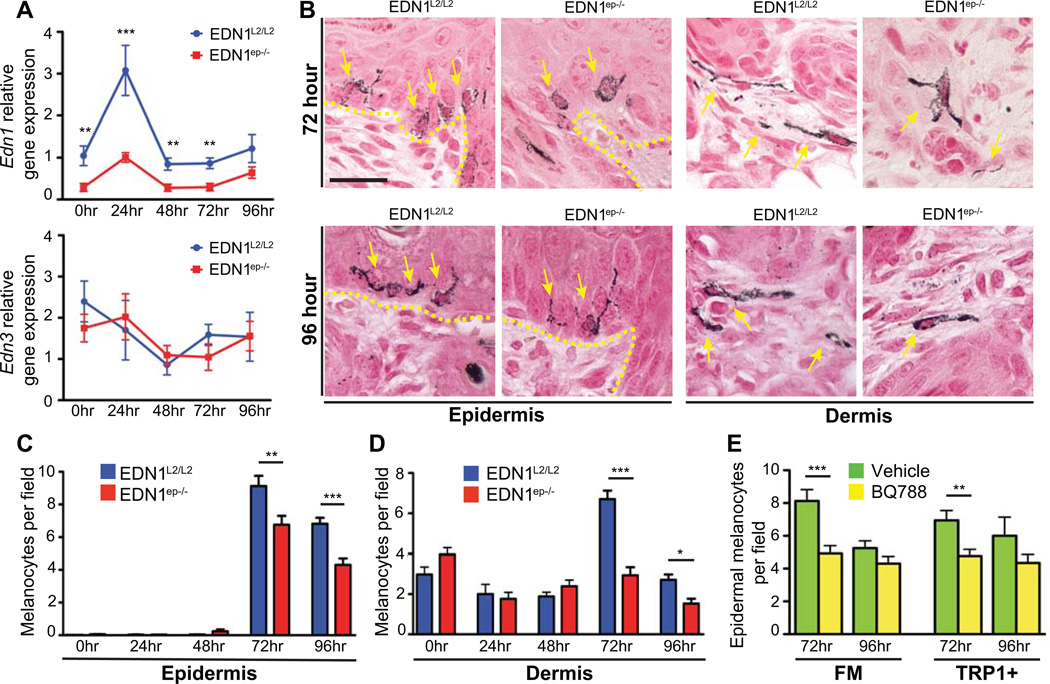
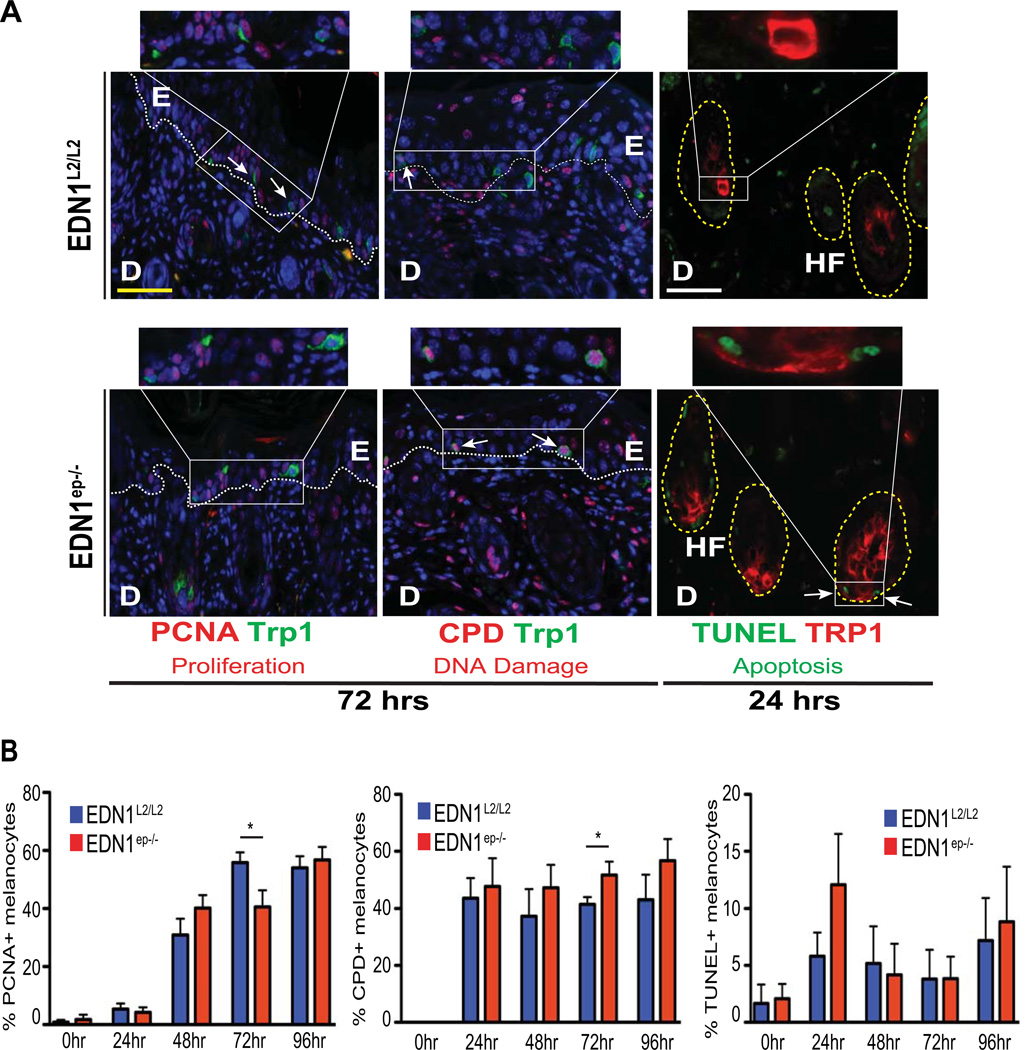
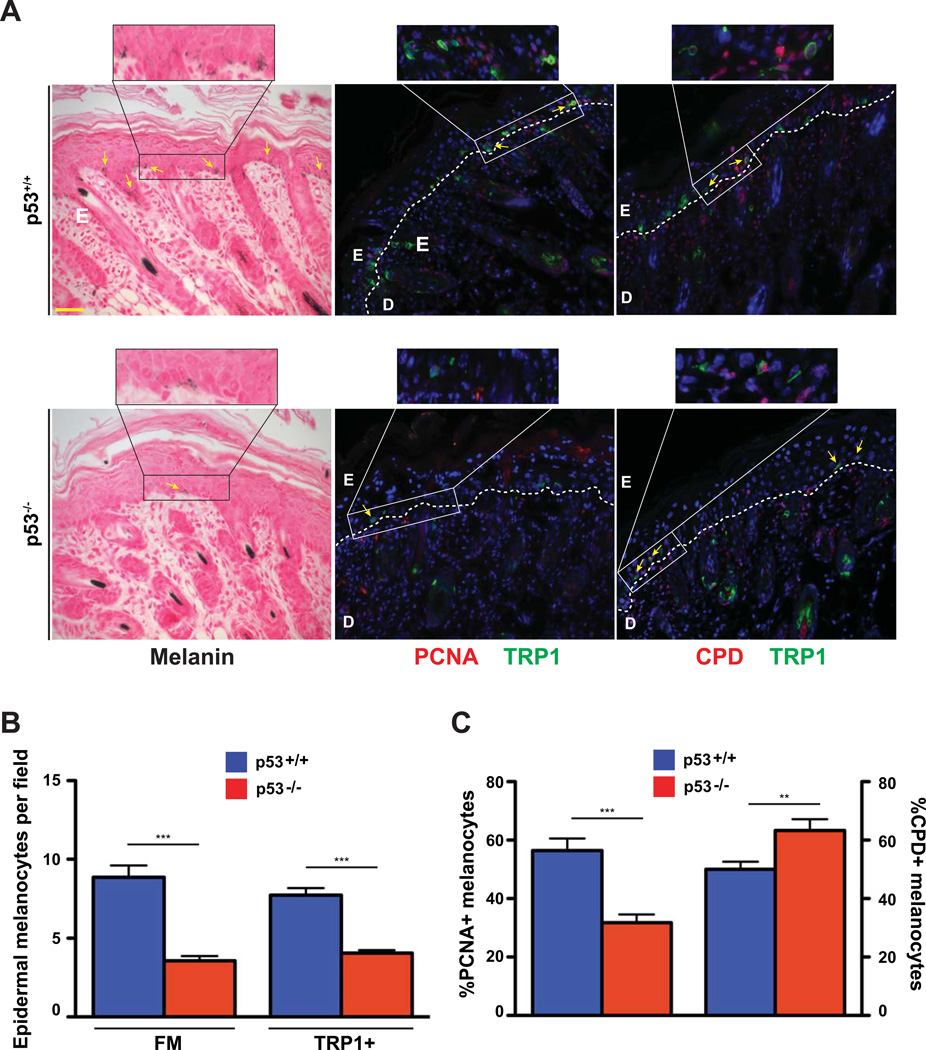
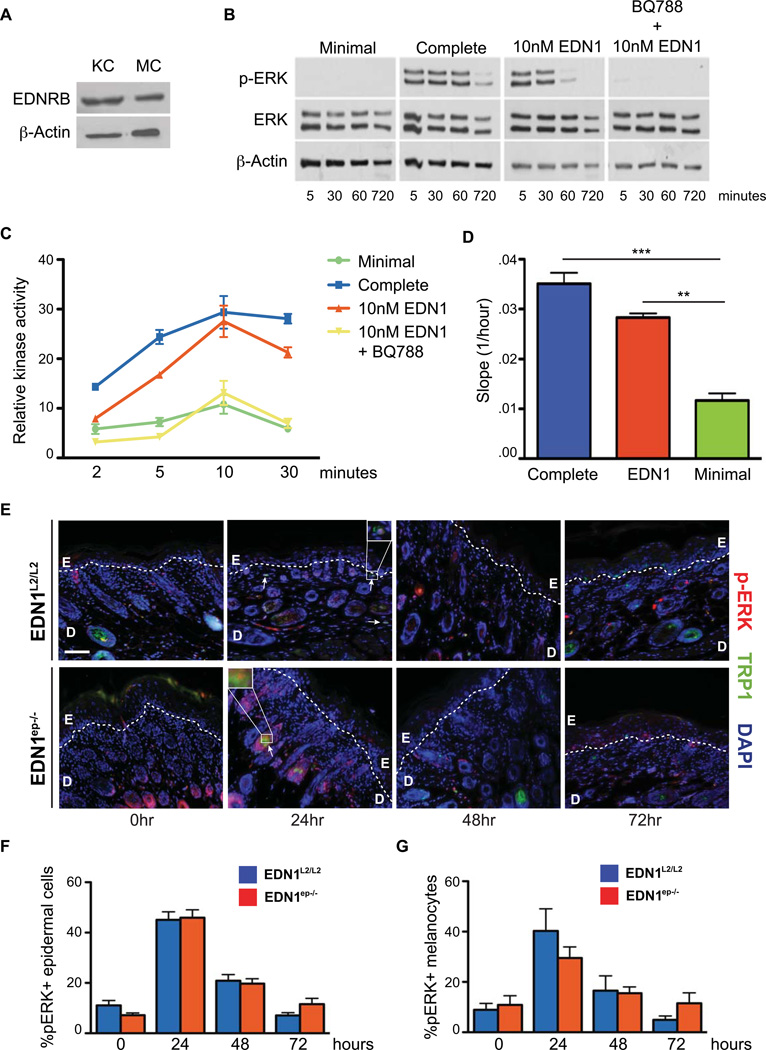
Keratinocytes contribute to melanocyte activity by influencing their microenvironment, in part, through secretion of paracrine factors. Here, we discovered that p53 directly regulates Edn1 expression in epidermal keratinocytes and controls UV-induced melanocyte homeostasis. Selective ablation of endothelin-1 (EDN1) in murine epidermis (EDN1(ep-/-) ) does not alter melanocyte homeostasis in newborn skin but decreases dermal melanocytes in adult skin. Results showed that keratinocytic EDN1 in a non-cell autonomous manner controls melanocyte proliferation, migration, DNA damage, and apoptosis after ultraviolet B (UVB) irradiation. Expression of other keratinocyte-derived paracrine factors did not compensate for the loss of EDN1. Topical treatment with EDN1 receptor (EDNRB) antagonist BQ788 abrogated UV-induced melanocyte activation and recapitulated the phenotype seen in EDN1(ep-/-) mice. Altogether, the present studies establish an essential role of EDN1 in epidermal keratinocytes to mediate UV-induced melanocyte homeostasis in vivo.
© 2012 John Wiley & Sons A/S.
Conflict of interest statement
The authors declare that no conflicting interests exist.
Figures
Similar articles
-
RXRα ablation in epidermal keratinocytes enhances UVR-induced DNA damage, apoptosis, and proliferation of keratinocytes and melanocytes.J Invest Dermatol. 2011 Jan;131(1):177-87. doi: 10.1038/jid.2010.290. Epub 2010 Oct 14. J Invest Dermatol. 2011. PMID: 20944655 Free PMC article.
-
The essential role of p53 in hyperpigmentation of the skin via regulation of paracrine melanogenic cytokine receptor signaling.J Biol Chem. 2009 Feb 13;284(7):4343-53. doi: 10.1074/jbc.M805570200. Epub 2008 Dec 18. J Biol Chem. 2009. PMID: 19098008
-
Narrow-band ultraviolet-B stimulates proliferation and migration of cultured melanocytes.Exp Dermatol. 2004 Dec;13(12):755-63. doi: 10.1111/j.0906-6705.2004.00221.x. Exp Dermatol. 2004. PMID: 15560759
-
Participation of keratinocyte- and fibroblast-derived factors in melanocyte homeostasis, the response to UV, and pigmentary disorders.Pigment Cell Melanoma Res. 2021 Jul;34(4):762-776. doi: 10.1111/pcmr.12985. Epub 2021 May 24. Pigment Cell Melanoma Res. 2021. PMID: 33973367 Free PMC article. Review.
-
The role of p53 in pigmentation, tanning and melanoma.Pigment Cell Melanoma Res. 2008 Oct;21(5):525-33. doi: 10.1111/j.1755-148X.2008.00495.x. Epub 2007 Aug 6. Pigment Cell Melanoma Res. 2008. PMID: 18761658 Review.
Cited by
-
UVB Stimulates the Expression of Endothelin B Receptor in Human Melanocytes via a Sequential Activation of the p38/MSK1/CREB/MITF Pathway Which Can Be Interrupted by a French Maritime Pine Bark Extract through a Direct Inactivation of MSK1.PLoS One. 2015 Jun 1;10(6):e0128678. doi: 10.1371/journal.pone.0128678. eCollection 2015. PLoS One. 2015. PMID: 26030901 Free PMC article.
-
CK1α ablation in keratinocytes induces p53-dependent, sunburn-protective skin hyperpigmentation.Proc Natl Acad Sci U S A. 2017 Sep 19;114(38):E8035-E8044. doi: 10.1073/pnas.1702763114. Epub 2017 Sep 6. Proc Natl Acad Sci U S A. 2017. PMID: 28878021 Free PMC article.
-
Cooperation of endothelin-1 signaling with melanosomes plays a role in developing and/or maintaining human skin hyperpigmentation.Biol Open. 2015 Sep 4;4(10):1213-21. doi: 10.1242/bio.011973. Biol Open. 2015. PMID: 26340945 Free PMC article.
-
DNA polymerase ζ deficiency causes impaired wound healing and stress-induced skin pigmentation.Life Sci Alliance. 2018 Jun;1(3):e201800048. doi: 10.26508/lsa.201800048. Epub 2018 Jun 29. Life Sci Alliance. 2018. PMID: 30046772 Free PMC article.
-
Loss of keratinocytic RXRα combined with activated CDK4 or oncogenic NRAS generates UVB-induced melanomas via loss of p53 and PTEN in the tumor microenvironment.Mol Cancer Res. 2015 Jan;13(1):186-96. doi: 10.1158/1541-7786.MCR-14-0164. Epub 2014 Sep 4. Mol Cancer Res. 2015. PMID: 25189354 Free PMC article.
References
-
- Ahn GY, Butt KI, Jindo T, Yaguchi H, Tsuboi R, Ogawa H. The expression of endothelin-1 and its binding sites in mouse skin increased after ultraviolet B irradiation or local injection of tumor necrosis factor alpha. J Dermatol. 1998;25:78–84. - PubMed
-
- Aoki H, Yamada Y, Hara A, Kunisada T. Two distinct types of mouse melanocyte: differential signaling requirement for the maintenance of non-cutaneous and dermal versus epidermal melanocytes. Development. 2009;136:2511–2521. - PubMed
-
- Arai H, Hori S, Aramori I, Ohkubo H, Nakanishi S. Cloning and expression of a cDNA encoding an endothelin receptor. Nature. 1990;348:730–732. - PubMed
-
- Cui R, Widlund HR, Feige E, Lin JY, Wilensky DL, Igras VE, D'orazio J, Fung CY, Schanbacher CF, Granter SR, et al. Central role of p53 in the suntan response and pathologic hyperpigmentation. Cell. 2007;128:853–864. - PubMed
-
- Demunter A, De Wolf-Peeters C, Degreef H, Stas M, Van Den Oord JJ. Expression of the endothelin-B receptor in pigment cell lesions of the skin. Evidence for its role as tumor progression marker in malignant melanoma. Virchows Arch. 2001;438:485–491. - PubMed
Publication types
MeSH terms
Substances
Grants and funding
LinkOut - more resources
Full Text Sources
Other Literature Sources
Research Materials
Miscellaneous
