

Integration method of 3D MR spectroscopy into treatment planning system for glioblastoma IMRT dose painting with integrated simultaneous boost
- PMID: 23280007
- PMCID: PMC3552736
- DOI: 10.1186/1748-717X-8-1
Integration method of 3D MR spectroscopy into treatment planning system for glioblastoma IMRT dose painting with integrated simultaneous boost
Abstract
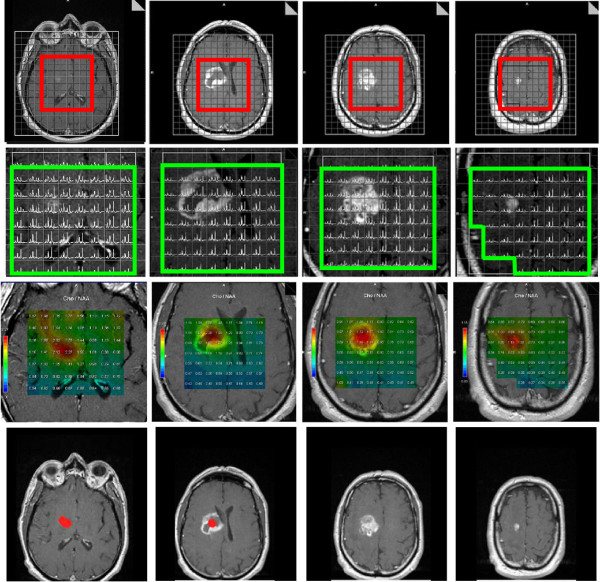
Background: To integrate 3D MR spectroscopy imaging (MRSI) in the treatment planning system (TPS) for glioblastoma dose painting to guide simultaneous integrated boost (SIB) in intensity-modulated radiation therapy (IMRT).
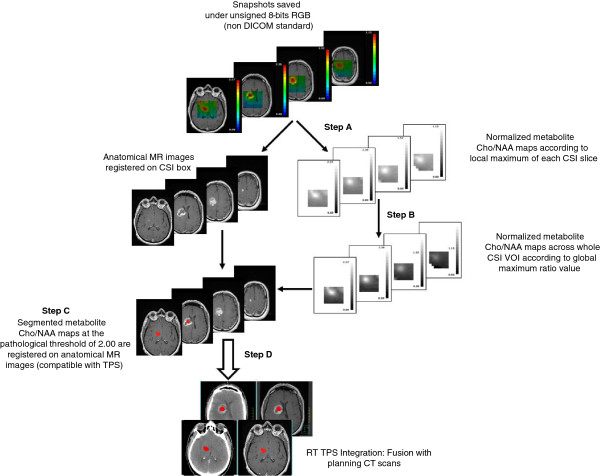
Methods: For sixteen glioblastoma patients, we have simulated three types of dosimetry plans, one conventional plan of 60-Gy in 3D conformational radiotherapy (3D-CRT), one 60-Gy plan in IMRT and one 72-Gy plan in SIB-IMRT. All sixteen MRSI metabolic maps were integrated into TPS, using normalization with color-space conversion and threshold-based segmentation. The fusion between the metabolic maps and the planning CT scans were assessed. Dosimetry comparisons were performed between the different plans of 60-Gy 3D-CRT, 60-Gy IMRT and 72-Gy SIB-IMRT, the last plan was targeted on MRSI abnormalities and contrast enhancement (CE).
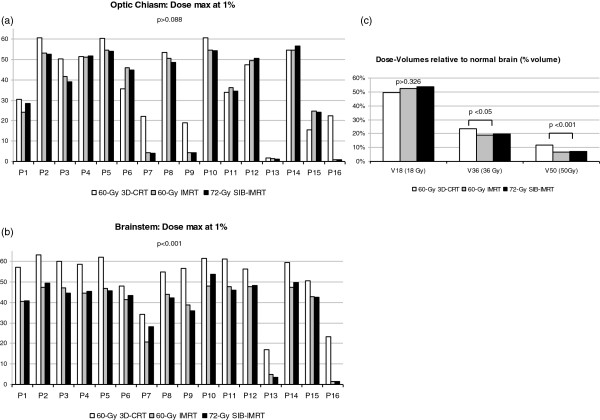
Results: Fusion assessment was performed for 160 transformations. It resulted in maximum differences <1.00 mm for translation parameters and ≤1.15° for rotation. Dosimetry plans of 72-Gy SIB-IMRT and 60-Gy IMRT showed a significantly decreased maximum dose to the brainstem (44.00 and 44.30 vs. 57.01 Gy) and decreased high dose-volumes to normal brain (19 and 20 vs. 23% and 7 and 7 vs. 12%) compared to 60-Gy 3D-CRT (p < 0.05).
Conclusions: Delivering standard doses to conventional target and higher doses to new target volumes characterized by MRSI and CE is now possible and does not increase dose to organs at risk. MRSI and CE abnormalities are now integrated for glioblastoma SIB-IMRT, concomitant with temozolomide, in an ongoing multi-institutional phase-III clinical trial. Our method of MR spectroscopy maps integration to TPS is robust and reliable; integration to neuronavigation systems with this method could also improve glioblastoma resection or guide biopsies.
Figures

Similar articles
-
Integrated-boost IMRT or 3-D-CRT using FET-PET based auto-contoured target volume delineation for glioblastoma multiforme--a dosimetric comparison.Radiat Oncol. 2009 Nov 23;4:57. doi: 10.1186/1748-717X-4-57. Radiat Oncol. 2009. PMID: 19930657 Free PMC article. Clinical Trial.
-
Radiotherapy of high-grade gliomas: current standards and new concepts, innovations in imaging and radiotherapy, and new therapeutic approaches.Chin J Cancer. 2014 Jan;33(1):16-24. doi: 10.5732/cjc.013.10217. Chin J Cancer. 2014. PMID: 24384237 Free PMC article. Review.
-
IMRT and 3D conformal radiotherapy with or without elective nodal irradiation in locally advanced NSCLC: A direct comparison of PET-based treatment planning.Strahlenther Onkol. 2016 Feb;192(2):75-82. doi: 10.1007/s00066-015-0900-9. Epub 2015 Oct 5. Strahlenther Onkol. 2016. PMID: 26438071 Clinical Trial.
-
Intensity modulated radiation therapy versus three-dimensional conformal radiation therapy for the treatment of high grade glioma: a dosimetric comparison.J Appl Clin Med Phys. 2007 Apr 19;8(2):47-60. doi: 10.1120/jacmp.v8i2.2423. J Appl Clin Med Phys. 2007. PMID: 17592465 Free PMC article.
-
The potential for an enhanced role for MRI in radiation-therapy treatment planning.Technol Cancer Res Treat. 2013 Oct;12(5):429-46. doi: 10.7785/tcrt.2012.500342. Epub 2013 Apr 24. Technol Cancer Res Treat. 2013. PMID: 23617289 Free PMC article. Review.
Cited by
-
Clinical Applications of Magnetic Resonance Spectroscopy in Brain Tumors: From Diagnosis to Treatment.Radiol Clin North Am. 2021 May;59(3):349-362. doi: 10.1016/j.rcl.2021.01.004. Epub 2021 Mar 23. Radiol Clin North Am. 2021. PMID: 33926682 Free PMC article. Review.
-
Dose-painting multicenter phase III trial in newly diagnosed glioblastoma: the SPECTRO-GLIO trial comparing arm A standard radiochemotherapy to arm B radiochemotherapy with simultaneous integrated boost guided by MR spectroscopic imaging.BMC Cancer. 2019 Feb 21;19(1):167. doi: 10.1186/s12885-019-5317-x. BMC Cancer. 2019. PMID: 30791889 Free PMC article. Clinical Trial.
-
The Role of Standard and Advanced Imaging for the Management of Brain Malignancies From a Radiation Oncology Standpoint.Neurosurgery. 2019 Aug 1;85(2):165-179. doi: 10.1093/neuros/nyy461. Neurosurgery. 2019. PMID: 30535032 Free PMC article. Review.
-
Current Clinical Brain Tumor Imaging.Neurosurgery. 2017 Sep 1;81(3):397-415. doi: 10.1093/neuros/nyx103. Neurosurgery. 2017. PMID: 28486641 Free PMC article. Review.
-
Isotoxic dose escalated radiotherapy for glioblastoma based on diffusion-weighted MRI and tumor control probability-an in-silico study.Br J Radiol. 2023 Jun 1;96(1146):20220384. doi: 10.1259/bjr.20220384. Epub 2023 Apr 27. Br J Radiol. 2023. PMID: 37102792 Free PMC article.
References
-
- Stupp R, Mason WP, van den Bent MJ, Weller M, Fisher B, Taphoorn MJ, Belanger K, Brandes AA, Marosi C, Bogdahn U, Curschmann J, Janzer RC, Ludwin SK, Gorlia T, Allgeier A, Lacombe D, Cairncross JG, Eisenhauer E, Mirimanoff RO. Radiotherapy plus concomitant and adjuvant temozolomide for glioblastoma. N Engl J Med. 2005;352:987–996. doi: 10.1056/NEJMoa043330. - DOI - PubMed
-
- Minniti G, Amelio D, Amichetti M, Salvati M, Muni R, Bozzao A, Lanzetta G, Scarpino S, Arcella A, Enrici RM. Patterns of failure and comparison of different target volume delineations in patients with glioblastoma treated with conformal radiotherapy plus concomitant and adjuvant temozolomide. Radiother Oncol. 2010;97:377–381. doi: 10.1016/j.radonc.2010.08.020. - DOI - PubMed
-
- Monjazeb AM, Ayala D, Jensen C, Case LD, Bourland JD, Ellis TL, McMullen KP, Chan MD, Tatter SB, Lesser GJ, Shaw EG. A phase I dose escalation study of hypofractionated IMRT field-in-field boost for newly diagnosed glioblastoma multiforme. Int J Radiat Oncol Biol Phys. 2012;82:743–748. doi: 10.1016/j.ijrobp.2010.10.018. - DOI - PMC - PubMed
Publication types
MeSH terms
Substances
LinkOut - more resources
Full Text Sources
Other Literature Sources
Medical
Research Materials
