

Effects of fructose vs glucose on regional cerebral blood flow in brain regions involved with appetite and reward pathways
- PMID: 23280226
- PMCID: PMC4076145
- DOI: 10.1001/jama.2012.116975
Effects of fructose vs glucose on regional cerebral blood flow in brain regions involved with appetite and reward pathways
Erratum in
- JAMA. 2013 May 1;309(17):1773
Abstract
Importance: Increases in fructose consumption have paralleled the increasing prevalence of obesity, and high-fructose diets are thought to promote weight gain and insulin resistance. Fructose ingestion produces smaller increases in circulating satiety hormones compared with glucose ingestion, and central administration of fructose provokes feeding in rodents, whereas centrally administered glucose promotes satiety.
Objective: To study neurophysiological factors that might underlie associations between fructose consumption and weight gain.
Design, setting, and participants: Twenty healthy adult volunteers underwent 2 magnetic resonance imaging sessions at Yale University in conjunction with fructose or glucose drink ingestion in a blinded, random-order, crossover design.
Main outcome measures: Relative changes in hypothalamic regional cerebral blood flow (CBF) after glucose or fructose ingestion. Secondary outcomes included whole-brain analyses to explore regional CBF changes, functional connectivity analysis to investigate correlations between the hypothalamus and other brain region responses, and hormone responses to fructose and glucose ingestion.
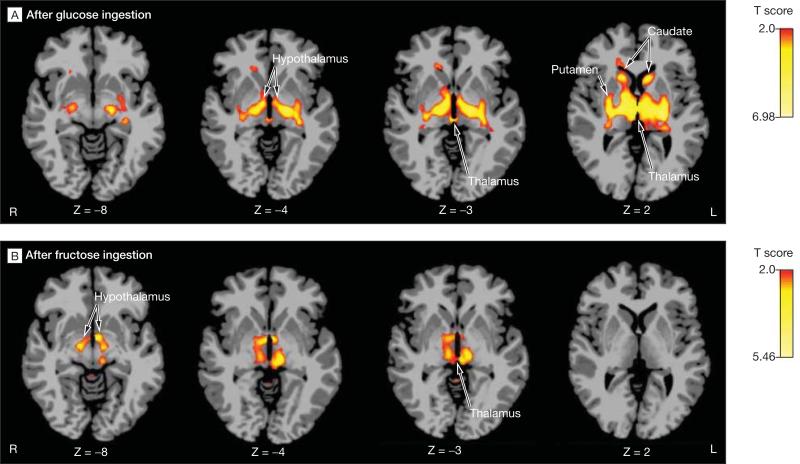
Results: There was a significantly greater reduction in hypothalamic CBF after glucose vs fructose ingestion (-5.45 vs 2.84 mL/g per minute, respectively; mean difference, 8.3 mL/g per minute [95% CI of mean difference, 1.87-14.70]; P = .01). Glucose ingestion (compared with baseline) increased functional connectivity between the hypothalamus and the thalamus and striatum. Fructose increased connectivity between the hypothalamus and thalamus but not the striatum. Regional CBF within the hypothalamus, thalamus, insula, anterior cingulate, and striatum (appetite and reward regions) was reduced after glucose ingestion compared with baseline (P < .05 significance threshold, family-wise error [FWE] whole-brain corrected). In contrast, fructose reduced regional CBF in the thalamus, hippocampus, posterior cingulate cortex, fusiform, and visual cortex (P < .05 significance threshold, FWE whole-brain corrected). In whole-brain voxel-level analyses, there were no significant differences between direct comparisons of fructose vs glucose sessions following correction for multiple comparisons. Fructose vs glucose ingestion resulted in lower peak levels of serum glucose (mean difference, 41.0 mg/dL [95% CI, 27.7-54.5]; P < .001), insulin (mean difference, 49.6 μU/mL [95% CI, 38.2-61.1]; P < .001), and glucagon-like polypeptide 1 (mean difference, 2.1 pmol/L [95% CI, 0.9-3.2]; P = .01).
Conclusion and relevance: In a series of exploratory analyses, consumption of fructose compared with glucose resulted in a distinct pattern of regional CBF and a smaller increase in systemic glucose, insulin, and glucagon-like polypeptide 1 levels.
Figures


Comment in
-
Fructose ingestion and cerebral, metabolic, and satiety responses.JAMA. 2013 Jan 2;309(1):85-6. doi: 10.1001/jama.2012.190505. JAMA. 2013. PMID: 23280229 No abstract available.
-
Differential effects of fructose and glucose on cerebral blood flow.JAMA. 2013 May 1;309(17):1768. doi: 10.1001/jama.2013.3358. JAMA. 2013. PMID: 23632709 No abstract available.
-
Differential effects of fructose and glucose on cerebral blood flow.JAMA. 2013 May 1;309(17):1768-9. doi: 10.1001/jama.2013.3364. JAMA. 2013. PMID: 23632710 No abstract available.
-
Differential effects of fructose and glucose on cerebral blood flow--reply.JAMA. 2013 May 1;309(17):1769. doi: 10.1001/jama.2013.3367. JAMA. 2013. PMID: 23632711 No abstract available.
References
-
- Havel PJ. Dietary fructose: implications for dys-regulation of energy homeostasis and lipid/carbohydrate metabolism. Nutr Rev. 2005;63(5):133–157. - PubMed
-
- Jürgens H, Haass W, Castañeda TR, et al. Consuming fructose-sweetened beverages increases body adiposity in mice. Obes Res. 2005;13(7):1146–1156. - PubMed
-
- Bray GA, Nielsen SJ, Popkin BM. Consumption of high-fructose corn syrup in beverages may play a role in the epidemic of obesity. Am J Clin Nutr. 2004;79(4):537–543. - PubMed
-
- Morton GJ, Cummings DE, Baskin DG, Barsh GS, Schwartz MW. Central nervous system control of food intake and body weight. Nature. 2006;443(7109):289–295. - PubMed
-
- Hanover LM, White JS. Manufacturing, composition, and applications of fructose. Am J Clin Nutr. 1993;58(5)(suppl):724S–732S. - PubMed
Publication types
MeSH terms
Substances
Grants and funding
LinkOut - more resources
Full Text Sources
Other Literature Sources
