. 2013 Jun;110(6):1782-93.
doi: 10.1002/bit.24823. Epub 2013 Feb 4.

Analysis of a high-throughput cone-and-plate apparatus for the application of defined spatiotemporal flow to cultured cells

Affiliations

Analysis of a high-throughput cone-and-plate apparatus for the application of defined spatiotemporal flow to cultured cells

Christopher Spruell et al. Biotechnol Bioeng. 2013 Jun.

Abstract

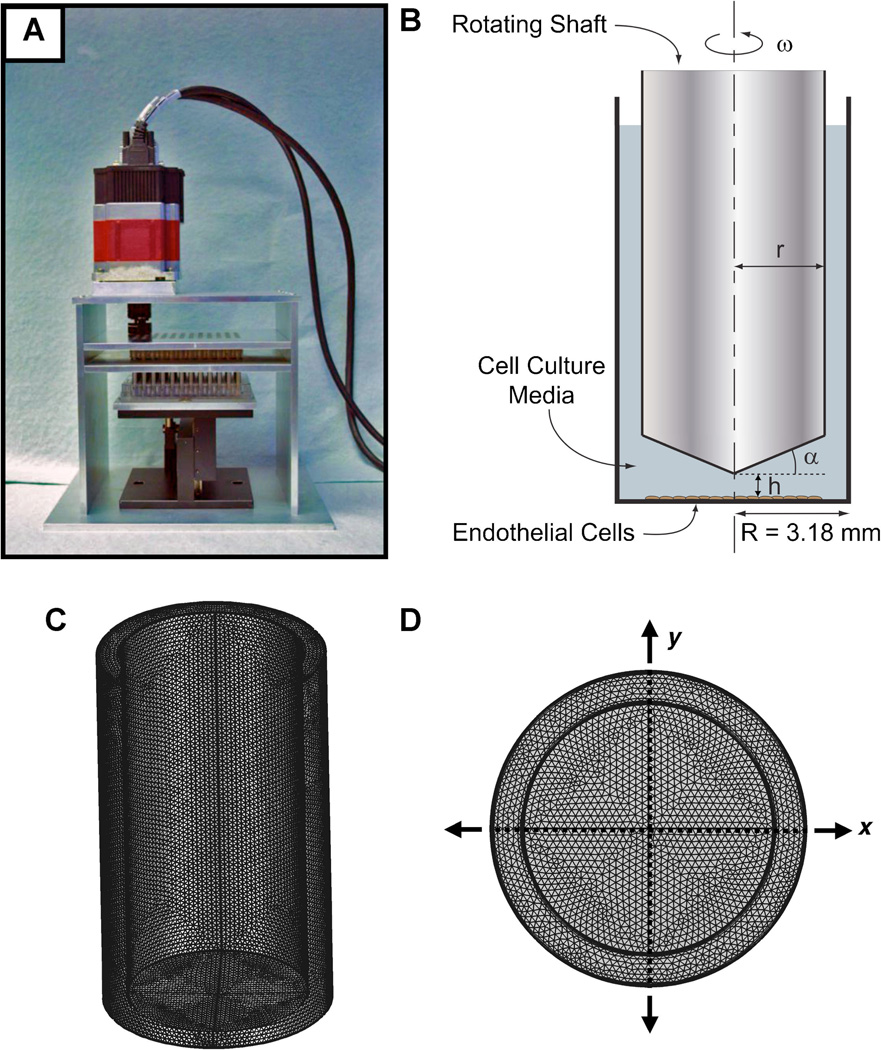
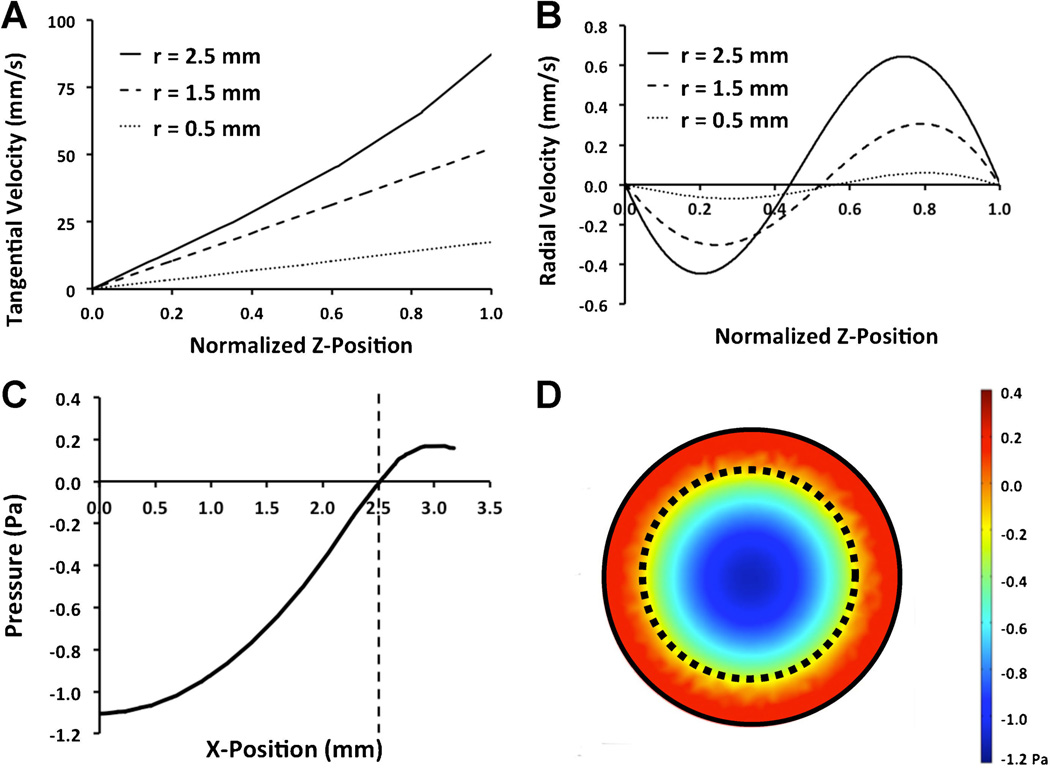
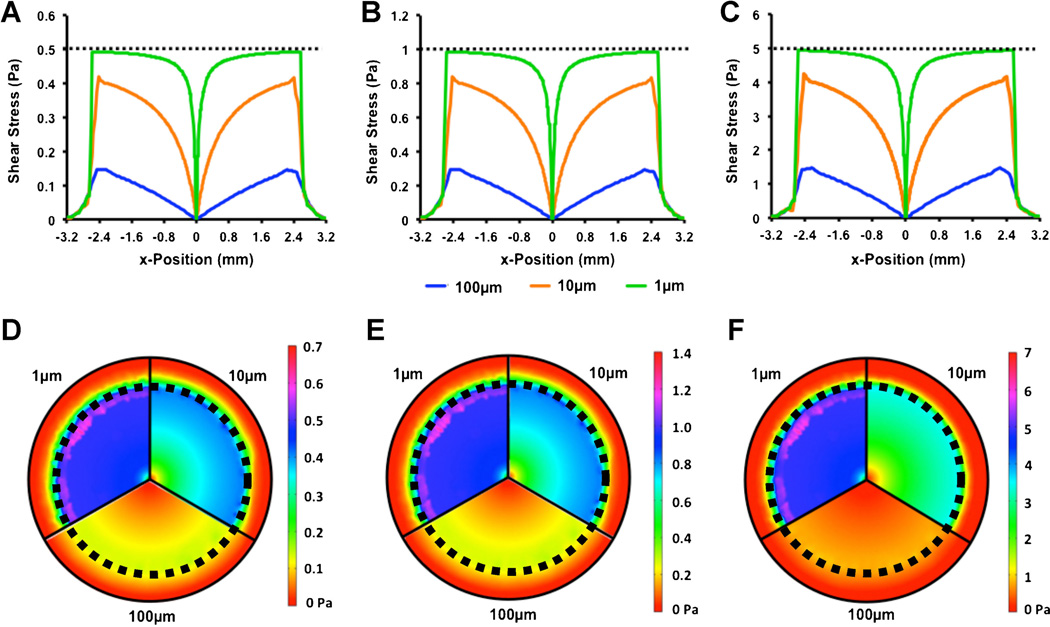
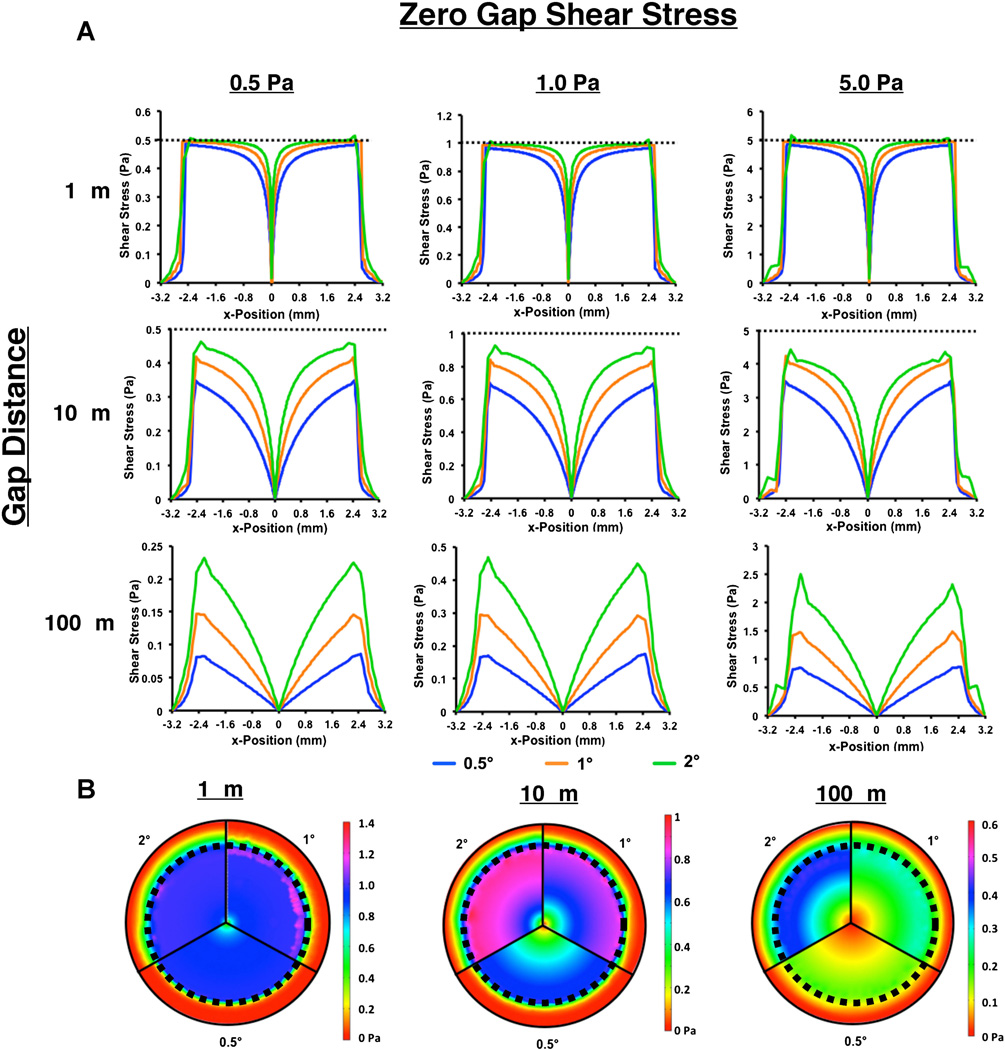
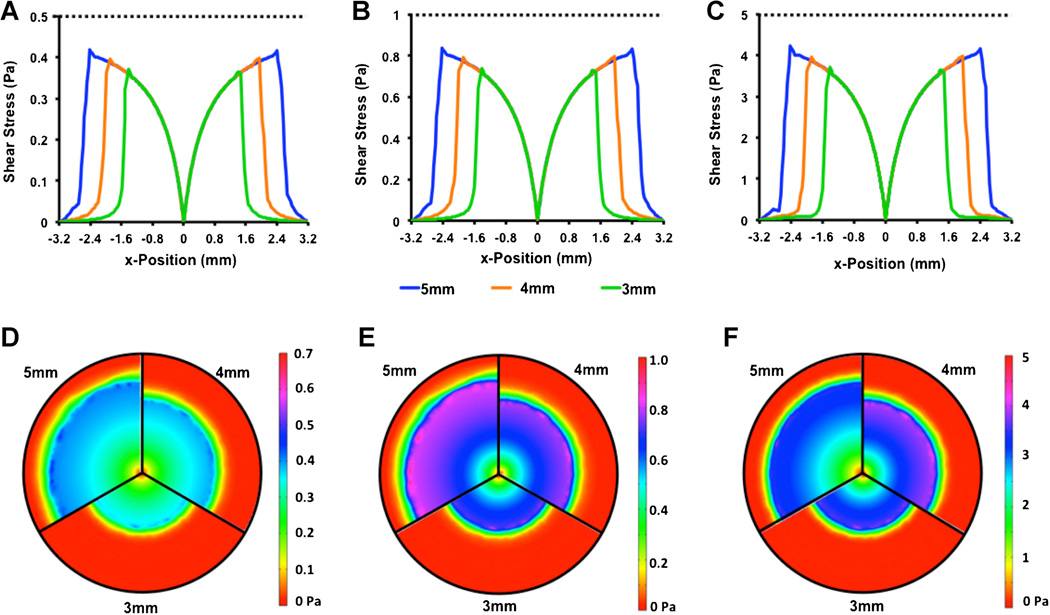
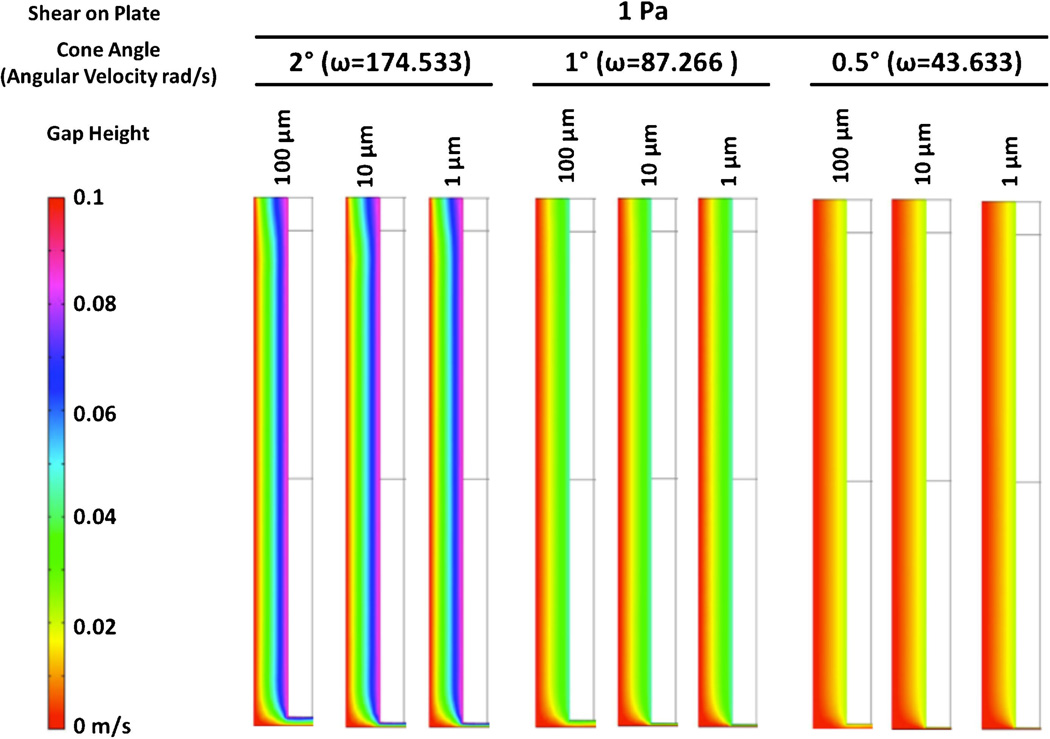
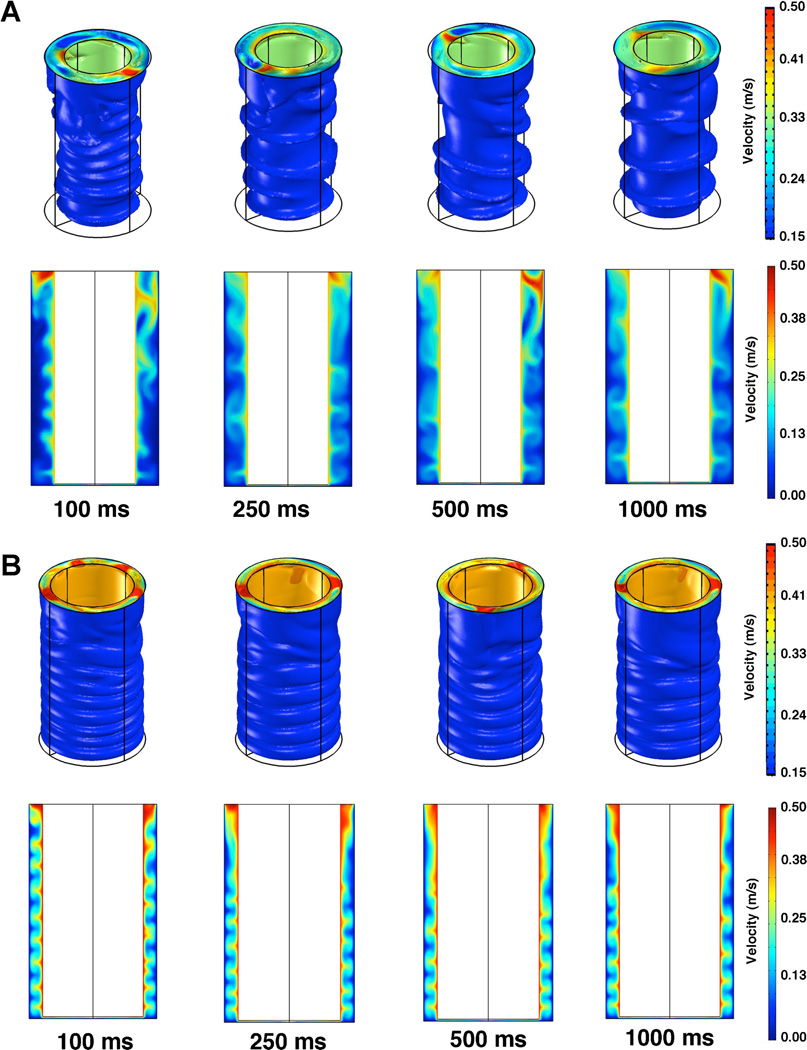
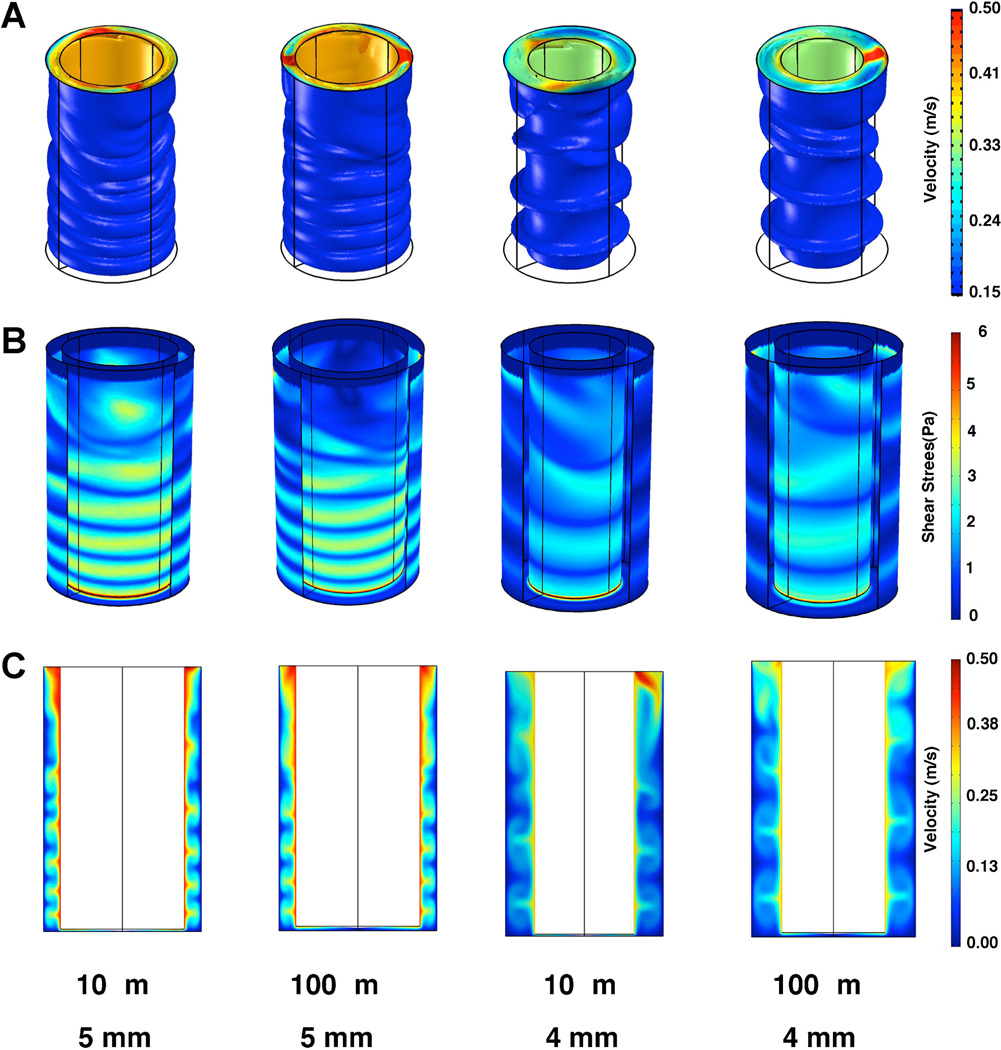
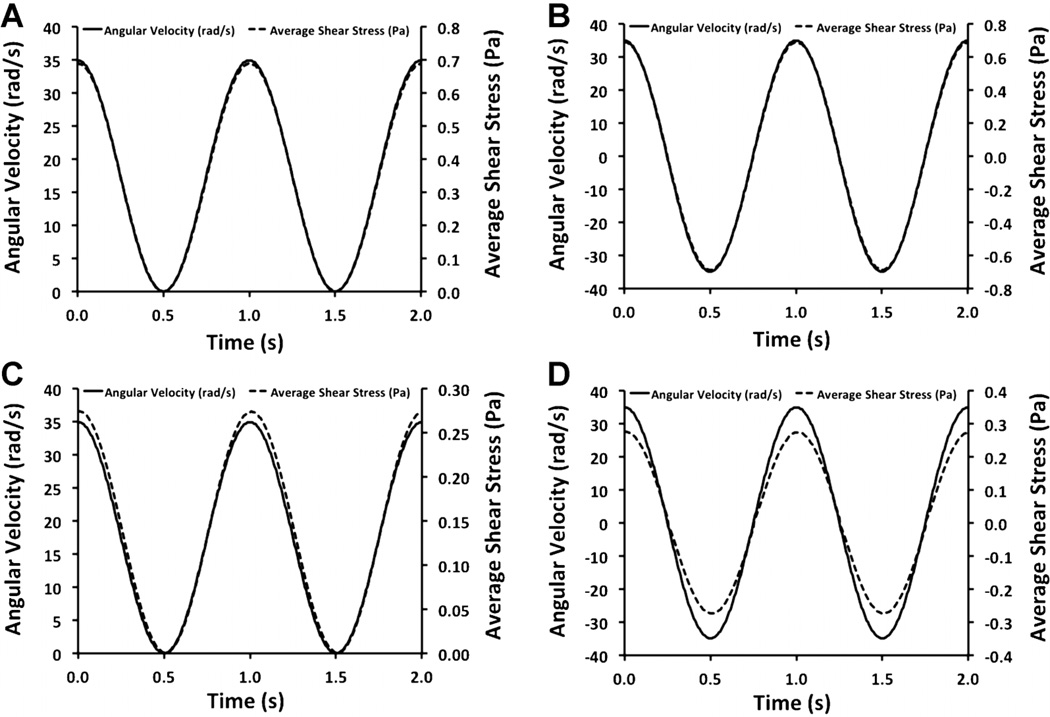
The shear stresses derived from blood flow regulate many aspects of vascular and immunobiology. In vitro studies on the shear stress-mediated mechanobiology of endothelial cells have been carried out using systems analogous to the cone-and-plate viscometer in which a rotating, low-angle cone applies fluid shear stress to cells grown on an underlying, flat culture surface. We recently developed a device that could perform high-throughput studies on shear-mediated mechanobiology through the rotation of cone-tipped shafts in a standard 96-well culture plate. Here, we present a model of the three-dimensional flow within the culture wells with a rotating, cone-tipped shaft. Using this model we examined the effects of modifying the design parameters of the system to allow the device to create a variety of flow profiles. We first examined the case of steady-state flow with the shaft rotating at constant angular velocity. By varying the angular velocity and distance of the cone from the underlying plate we were able to create flow profiles with controlled shear stress gradients in the radial direction within the plate. These findings indicate that both linear and non-linear spatial distributions in shear stress can be created across the bottom of the culture plate. In the transition and "parallel shaft" regions of the system, the angular velocities needed to provide high levels of physiological shear stress (5 Pa) created intermediate Reynolds number Taylor-Couette flow. In some cases, this led to the development of a flow regime in which stable helical vortices were created within the well. We also examined the system under oscillatory and pulsatile motion of the shaft and demonstrated minimal time lag between the rotation of the cone and the shear stress on the cell culture surface.


Figures

Figure 1
Figure 1
High-throughput device for the application of shear stress to cells in the standard 96-well format. The device works by rotating 96 parallel shafts in the wells to create fluid flow. Each shaft has a low-angle cone on the tip. The motion of the shafts is driven by an electric motor and transferred the other shafts through a custom-designed gearbox. A micropositioning stage with a mounting plate for the 96-well culture plate is used to accurately control the position of the culture plate relative to the rotating shafts. B: Diagram of a single well with rotating shaft where h is the height of the cone above the bottom of the plate, α is the angle of the cone, ω is the angular velocity of the spinning shaft/cone, r is the radius of the shaft/cone, and R is the radius of the well. C: Example of meshing used for the simulations. D: End view of meshed system.
Figure 2
Figure 2
Tangential and circumferential velocities within the gap region beneath the cone. A: Tangential velocity at three radial locations in the gap region. The radial velocity was linear with respect to the height from the surface (Z position) for most of the gap region. At the edge of the cone (r = 2.5 mm), there was a slightly non-linear relation with height from the surface. B: The radial velocity profile demonstrated an outward velocity near the rotating cone and an inward velocity closer to the culture surface. C: Gauge pressure at the bottom of the well with a gap height of 100 µm and 5 mm shaft, 2° cone angle at 1 µm gap distance with angular velocity of 174.5 rad/s. D: Visualization of gauge pressure beneath rotating cone.
Figure 3
Figure 3
Effect of gap height on shear stress profiles on cell culture surface. Profiles along a line transecting the bottom of the culture well for a zero gap shear of 0.5 (A, D), 1.0 (B, E), and 5.0 Pa (C, F). Dotted line in (A)–(C) represents the zero gap shear stress. Heat maps (D)–(F) are visual representations of their respective above graph and include slices for each height. Dotted line in (D)–(F) represents the area in which cells are cultured.
Figure 4
Figure 4
Effect of cone angle on shear stress profiles on cell culture surface. A: Shear stress values for a line at the bottom of the culture well. The x-axis is located at the center of the bottom of the culture well. Dotted line represents the zero gap shear stress. B: Visualization of shear field on the bottom of culture well for a zero gap shear stress of 1.0 Pa. Dotted line represents the area in which cells are cultured.
Figure 5
Figure 5
Effect of shaft diameter on shear stress profiles generated from cone rotation. Simulations were run for a zero gap shear stress of 0.5 Pa (A, D), 1 Pa (B, E), and 5 Pa (C, F) and at a gap distance of 10 µm and a cone angle of 1°. The shaft diameter was varied between 3 and 5 mm.
Figure 6
Figure 6
Flow velocities within the gap region between the rotating shaft and the surrounding culture lack instabilities in the 1 Pa zero gap shear stress case. Flow velocities are shown for constant zero gap shear stress of 1 Pa. The cone surface is on the right side of each cross-sectional view. “Shear on plate” is the ideal case, zero gap shear stress on the culture surface.
Figure 7
Figure 7
Time sequence of flow after initial acceleration of the shaft from rest. A: Time-dependent simulation of flow for the 4mm shaft case with a 10-µm gap between the cone tip and culture surface. Shown are the velocity isosurfaces for flow and the velocity field on a cut plane passing through the vertex of the cone/center of the plate. All values shown are velocity in m/s. B: Time-dependent simulation of flow for the 5 mm shaft case with a 10-µm gap distance. Shown are isosurfaces and velocity fields on a cut plane through the vertex of the cone.
Figure 8
Figure 8
Comparison of flow in the shaft gap region under various conditions/designs. A: Velocity isosurfaces (m/s) for flow after 1,000 ms of shaft rotation for the 5 mm diameter shaft case or 4,000 ms of shaft rotation for the 4 mm diameter shaft. B: Wall shear stress (Pa) in the system (part of the outer wall has been hidden to aid visualization). C: Velocity field (m/s) on a cut plane passing through the center of the system.
Figure 9
Figure 9
Unsteady flow simulations for the cone-and-plate device. A: Average shear stress in cell culture region under pulsatile flow with a gap height of 1 µm. B: Shear stress in cell culture region under oscillatory flow with a gap height of 1 µm. C: Shear stress in cell culture region under pulsatile flow with a 2° cone angle and a 100-µm gap height. D: Shear stress in cell culture region under oscillatory flow a 2° cone angle and 100-µm gap height.

Similar articles

Cited by

References

    1. Bao X, Lu C, Frangos JA. Temporal gradient in shear but not steady shear stress induces PDGF-A and MCP-1 expression in endothelial cells: Role of NO, NF kappa B, and egr-1. Arterioscler Thromb Vasc Biol. 1999;19(4):996–1003. - PubMed
    1. Blackman BR, Garcia-Cardena G, Gimbrone MA., Jr A new in vitro model to evaluate differential responses of endothelial cells to simulated arterial shear stress waveforms. J Biomech Eng. 2002;124(4):397–407. - PubMed
    1. Buschmann MH, Dieterich P, Adams NA, Schnittler HJ. Analysis of flow in a cone-and-plate apparatus with respect to spatial and temporal effects on endothelial cells. Biotechnol Bioeng. 2005;89(5):493–502. - PubMed
    1. Carlson DR, Widnall SE, Peeters MF. A flow-visualization study of transition in plane Poiseuille flow. J Fluid Mech. 1982;121:487–505.
    1. Chatzizisis YS, Baker AB, Sukhova GK, Koskinas KC, Papafaklis MI, Beigel R, Jonas M, Coskun AU, Stone BV, Maynard C, Shi GP, Libby P, Feldman CL, Edelman ER, Stone PH. Augmented expression and activity of extracellular matrix-degrading enzymes in regions of low endothelial shear stress colocalize with coronary atheromata with thin fibrous caps in pigs. Circulation. 2011;123(6):621–630. - PMC - PubMed