. 2012 Dec;72(6):936-51.
doi: 10.1002/ana.23690.

Central axons preparing to myelinate are highly sensitive [corrected] to ischemic injury

Affiliations

Central axons preparing to myelinate are highly sensitive [corrected] to ischemic injury

James J P Alix et al. Ann Neurol. 2012 Dec.

Erratum in

  • Ann Neurol. 2014 Mar;75(3):465

Abstract

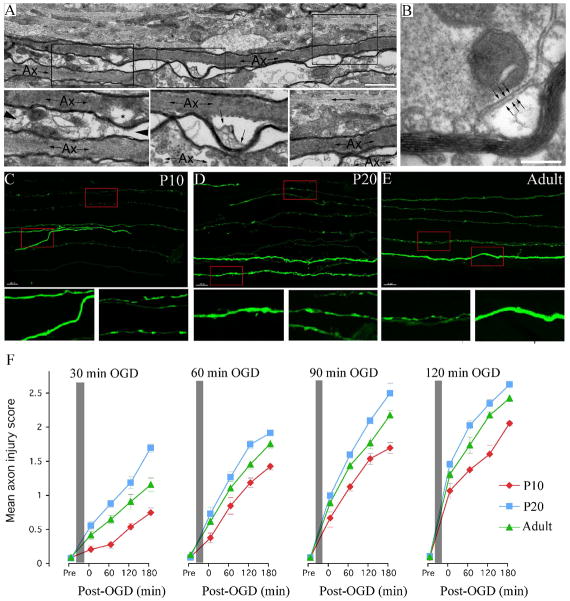
Objective: Developing central white matter is subject to ischemic-type injury during the period that precedes myelination. At this stage in maturation, central axons initiate a program of radial expansion and ion channel redistribution. Here we test the hypothesis that during radial expansion axons display heightened ischemic sensitivity, when clusters of Ca(2+) channels decorate future node of Ranvier sites.

Methods: Functionality and morphology of central axons and glia were examined during and after a period of modeled ischemia. Pathological changes in axons undergoing radial expansion were probed using electrophysiological, quantitative ultrastructural, and morphometric analysis in neonatal rodent optic nerve and periventricular white matter axons studied under modeled ischemia in vitro or after hypoxia-ischemia in vivo.

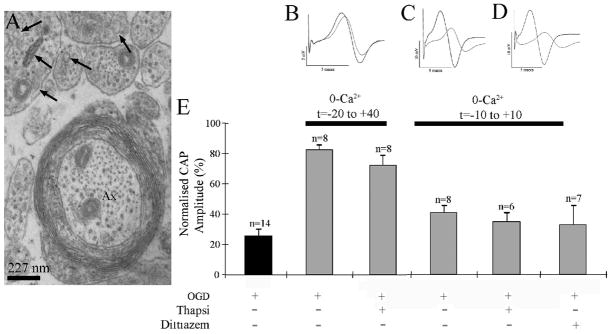
Results: Acute ischemic injury of central axons undergoing initial radial expansion was mediated by Ca(2+) influx through Ca(2+) channels expressed in axolemma clusters. This form of injury operated only in this axon population, which was more sensitive to injury than neighboring myelinated axons, smaller axons yet to initiate radial expansion, astrocytes, or oligodendroglia. A pharmacological strategy designed to protect both small and large diameter premyelinated axons proved 100% protective against acute ischemia studied under modeled ischemia in vitro or after hypoxia-ischemia in vivo.

Interpretation: Recent clinical data highlight the importance of axon pathology in developing white matter injury. The elevated susceptibility of early maturing axons to ischemic injury described here may significantly contribute to selective white matter pathology and places these axons alongside preoligodendrocytes as a potential primary target of both injury and therapeutics.


Figures

Figure 1
Figure 1
OGD-induced injury in rodent axons. A: Long section ultra-micrograph from a post-OGD P10 RON, showing regional myelin detachment from the axoplasm, shown in cross section in “B”. “Ax” = myelinated axon. Note the bubbling of membrane within the expanded axo-glia space (arrows). Bar = 100 nm. C-E Pathological changes in GFP-M axons in THY-1/GFP-M mice at P10 (C), P20 (D) and adult (E) exposed to 60 min OGD + 60 min recovery. Boxed regions are expanded below. Note the differential injury in the smallest GFP-M(+) axons which show beading and localized swelling. Bar = 10 μm. F: The mean axon injury score of GFP-M(+) axons collected after 30, 60, 90 or 120 min of OGD (indicated by the grey bar). Data collected from P10 (red), P20 (blue) and adult (green) MONs is included. Note that the extent of injury increases in all age groups with the period of OGD and the length of recovery. Note also that axon injury in P20 MONs is higher under all conditions than at P10 or adult.
Figure 2
Figure 2
Central axons preparing for myelination have a heightened sensitivity to OGD. A: Electron micrograph of wild-type P20 MON showing pre-myelinated axons (arrows), ensheathed axons (arrow heads) and early myelinated axons (“Ax”) in cross section (bar = 1 μm). B–D: Diameter spectra for pre-myelinated axons (B), ensheathed axons (C) and myelinated axons (D). E: GFP-M fluorescent axons in transgenic P20 MON (bar = 5 μm). F: Diameter spectrum of fluorescent axons. G: Injury scores for fluorescent axons following 60 min OGD + 60 min recovery, plotted against axon diameter. Note that the smallest fluorescent axons, corresponding to large pre- myelinated and enstheathed axons, are the most damaged.
Figure 3
Figure 3
Large pre-myelinated axon damage in a model of limited hypoxic-ischemic periventricular white matter injury. A: Two large diameter pre-myelinated axons show focal pathology (large arrows) including axolemma swelling and numerous convoluted profiles within the axoplasm. Note neighboring smaller diameter axons appear normal. B: A large diameter pre-myelinated axon (arrows) exhibits severe local swelling (boxed area shown below). Note the disorganization of microtubules as they enter the swollen region (arrow heads) and the debris within the swollen axoplasm. C: A localized region of swelling (large arrows) appears to be associated with axon transection. Note the displacement of neighboring smaller diameter axons which otherwise have retained a normal appearance. D: Cross-section micrographs showing selective damage of large pre-myelinated axons (arrows), which can often be positively identified by the presence of remaining microtubule profiles (“*”). Neighboring small diameter axons retain a typical structure and include mitochondria with a normal appearance (arrow heads, top left example shown at higher gain in the insert). E: An oligodendrocyte (“Oli”) retains almost normal appearance with an intact cell membrane (arrow heads) and cellular inclusions such as mitochondria and Golgi apparatus. Near-by small diameter axon profiles are normal but several large diameter pre-myelinated axons exhibit pathology (arrows). F: Blind injury scoring of pre-myelinated axons that are either <0.4 μm (black bars) or >0.4 μm (open bars) in diameter. Note that after H-I there is a significant injury of the larger diameter axons (***= P<0.001).
Figure 4
Figure 4
Hypoxia-ischemia at P7 triggers preOL degeneration in rat cerebral cortex via a spectrum of apoptotic-necrotic injury. PreOLs were visualized by immuno-EM localization of the O4 antibody (see .). In the intact cell, O4-labeling normally localizes to the plasma membrane, but in degenerating cells, cytoplasmic labeling was seen (see ). A: Typical features of an O4 antibody-labeled cell showing injury towards the apoptotic end of the cell death spectrum, visualized by immuno-EM. Large arrowheads indicate immuno-label localized to the plasma membrane. Some labeling (short arrows) was associated with more superficial or internalized apparently membranous vesicles of varying size that appear to derive from the plasma membrane. Note the apoptotic-appearing nucleus (n) with condensed chromatin. Large intracellular vesicles (v) and apparent swollen mitochondria (long arrows) are typical features of apoptotic-like preOLs that have also been observed in vitro. The swollen mitochondrion (lower long arrow) is shown in detail in the inset at lower right in panel “C”. B: Typical features of an O4 antibody-labeled preOL showing features of necrotic-like degeneration. Note the necrotic-appearing nucleus (n) with glassy appearance and the extensive cytoplasmic and peri-nuclear O4-labeling (arrowheads) consistent with breakdown of the plasma membrane. C: The typical features of an apoptotic-like O4-labeled cell preOL (OL; centre) are distinct from the adjacent apoptotic cell at left, which is an apparent neuron with more normal-appearing mitochondria (m), perinuclear Golgi apparatus and evidence of the nuclear membrane, none of which is observed in the apoptotic preOL. The preOL displays swollen mitochondria (m), whereas the mitochondria in adjacent cells appear normal. The intact-appearing mitochondrion at upper right is shown in the inset at lower left. Note the cytoplasmic O4-labeling (arrows), which is associated with membranous vesicles that may be derived from internalized plasma membrane. Bars = 1 μm.
Figure 5
Figure 5
Block of intracellular Ca2+ release in not protective of P10 RON axons. A: High-power electron micrograph showing the presence of intracellular inclusions with the features of endoplasmic reticulum in premyelinated and actively myelinating axons (e.g., arrows). B: CAPs recorded from a RON that was exposed to zero Ca2+/50 μM EGTA, plus thapsigargin from 20 min prior to the onset of OGD, to 40 min post OGD (t=-20 to + 40). C: CAPs from an experiment in which the RON was exposed to zero Ca2+/50 μM EGTA plus thapsigargin from t=-10 min to + 10 min. D: CAPs from an experiment in which the RON was exposed to zero Ca2+/50 μM EGTA plus diltiazem from t=-10 min to + 10 min. E: Data summary showing that neither thapsigargin protocol nor diltiazem significantly increased the degree of recovery compared to the relevant control.
Figure 6
Figure 6
Combined GluR and VGCC block is highly protective of all premyelinated axons. A: In the presence of ω-agatoxin VIA+diltiazem+MK-801+NBQX (“All treatments”) CAP area recovered fully from a 60 min period of OGD. The inserts at the top show representative CAPs recorded at time zero (black) and at the end of the recovery period (red); from left to right these traces represent control (where traces largely overlap due to excellent recording stability), OGD and “all treatments” paradigms respectively. Bars = 2 mV/ 1 msec. The mean recovery data is shown lower right. B: Electron-micrograph showing typical ultrastructural changes following the OGD protocol in the absence of drugs. Some premyelinated axons can be distinguished by the presence of microtubules, while a larger diameter ensheathed axons (arrow head) has lost all microtubules. Bar = 0.5 μm. C: NF-L and NF-H staining was also protected during OGD by the “all treatments” protocol. NF stained axons have a normal appearance following 60 min of OGD and recovery and mean staining intensity is not significantly different from control staining. D, E: The ultrastructural features of axons in nerves exposed to 60 min OGD and recovery in the presence of ω-agatoxin VIA+diltiazem+MK-801+NBQX appear largely normal. Even large pre- myelinated axons retain membrane integrity and contain microtubules (arrows), while several axonal mitochondria can be seen to have a normal structure. Myelinated axons (“Ax”) retain membrane integrity but appear to have few microtubules and exhibit myelin pathology. Bar = 1 μm. F: Axon health was assessed using an established scoring protocol (axon viability score), where a score of three represents a normal appearance and zero represents total axon breakdown. Axon viability scores generally fall between two and three following OGD in the presence of ω-agatoxin VIA+diltiazem+MK-801+NBQX when examined against axonal diameter. G: Mean viability score in treated RONs for small (<0.4μm diameter, black bars) and large (>0.4μm diameter, white bars) pre-myelinated axon does not differ significantly from control.
Figure 7
Figure 7
Addition of VGCC block to GluR block protected larger pre-myelinated axons. Morphometric analysis of OGD induced axon injury. A: The number of microtubules present in axons is plotted for small-diameter (<0.4μm) and large diameter (>0.4 μm) premyelinated axons in RONs collected after various protocols. Microtubule number in small axons falls significantly following OGD, an effect that is countered by GluR block; this effect is not augmented by combined GluR + VGCC block (“All treatments”). Microtubule number in larger axons falls significantly following OGD, an effect that is not reduced by GluR block but is prevented by combined GluR and VGCC block. B: Microtubule number plotted against axon diameter for individual axons. Data for premyelinated (filled symbols), ensheathed (open circles) and myelinated (open squares) are included. The data show that larger axons contain more microtubules, a relationship that breaks down following OGD (the largest diameter axons are include in the insert). During combined GluR and VGCC block, the relationship between microtubule number and diameter is largely preserved, while GluR block alone has no such effect. C: Mean microtubule number plotted against axon diameter (0.05 μm bins) for pre-myelinated axons. Note that OGD produces a significant reduction in the number of microtubules at any given axon diameter while GluR block protects the smaller axons and “all treatments” prevents the loss of microtubules across the whole diameter spectrum (“*” = P<0.05 vs., control).

References

    1. Back SA. Perinatal white matter injury: the changing spectrum of pathology and emerging insights into pathogenetic mechanisms. Ment Retard Dev Disabil Res Rev. 2006;12:129–140. - PubMed
    1. Back SA, Rivkees SA. Emerging concepts in periventricular white matter injury. Semin Perinatol. 2004;28:405–414. - PubMed
    1. Khwaja O, Volpe JJ. Pathogenesis of cerebral white matter injury of prematurity. Arch Dis Child Fetal Neonatal Ed. 2008;93:F153–161. - PMC - PubMed
    1. Volpe JJ. Neurology of the newborn. Philadelphia: W.B. Saunders Company; 1995.
    1. Bax M, Tydeman C, Flodmark O. Clinical and MRI correlates of cerebral palsy: the European Cerebral Palsy Study. Jama. 2006;296:1602–1608. - PubMed

Publication types

MeSH terms