. 2013 May;28(5):1214-28.
doi: 10.1002/jbmr.1851.

DNA damage drives accelerated bone aging via an NF-κB-dependent mechanism

Affiliations

DNA damage drives accelerated bone aging via an NF-κB-dependent mechanism

Qian Chen et al. J Bone Miner Res. 2013 May.

Abstract

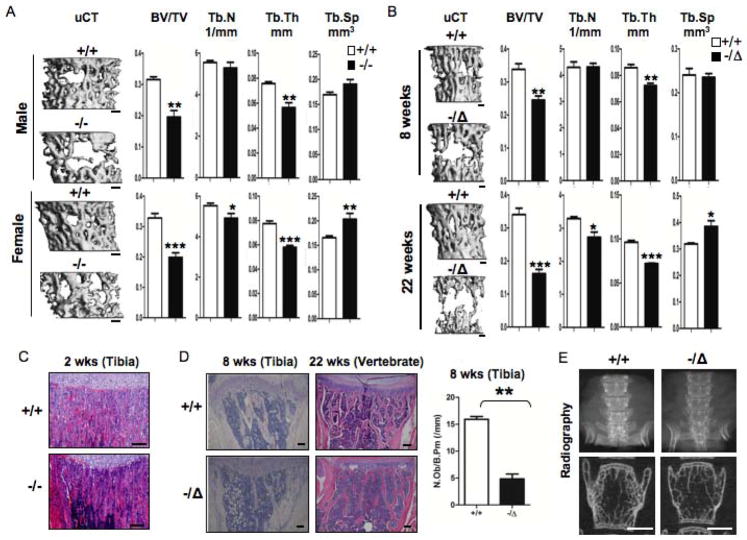
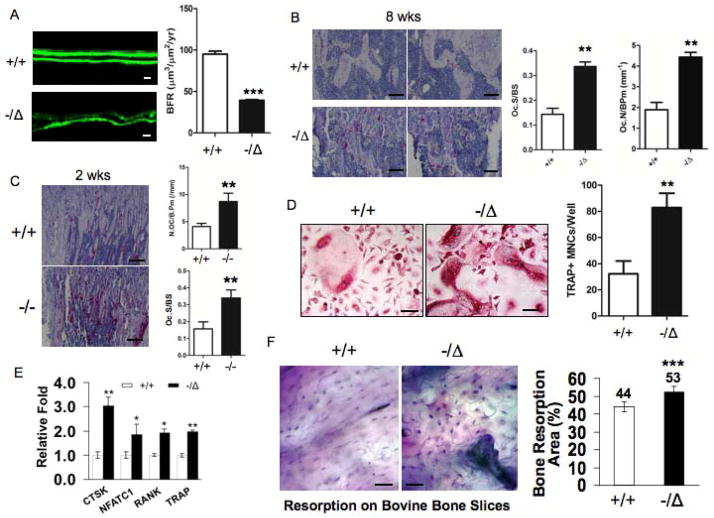
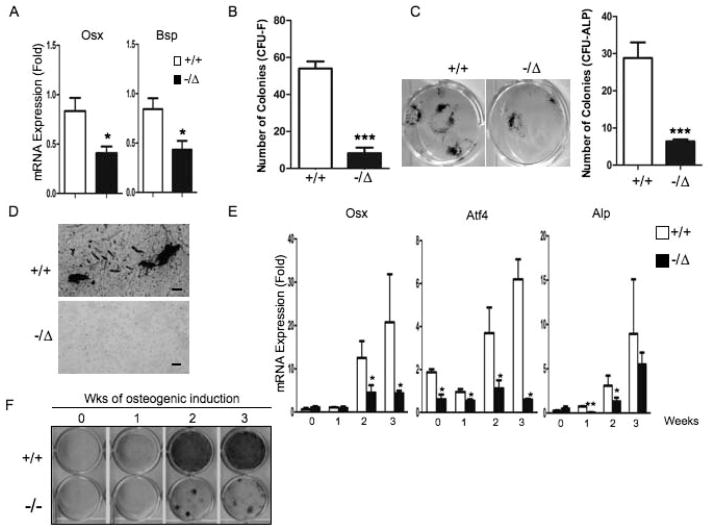
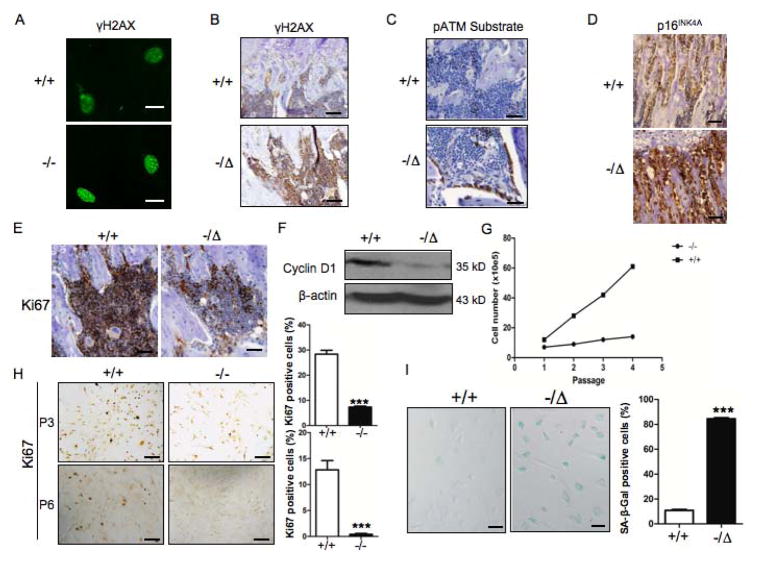
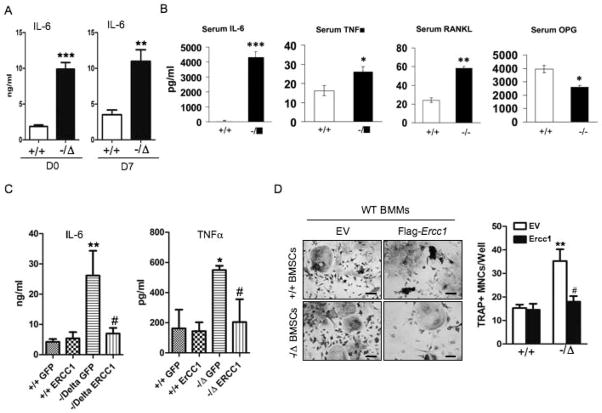
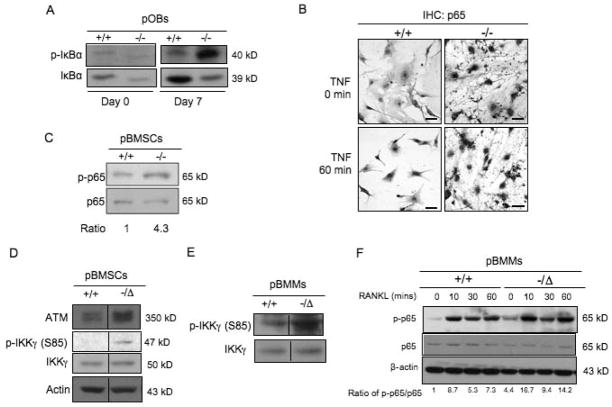
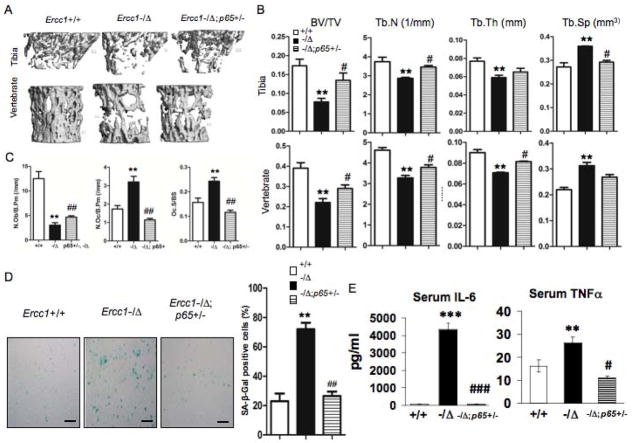
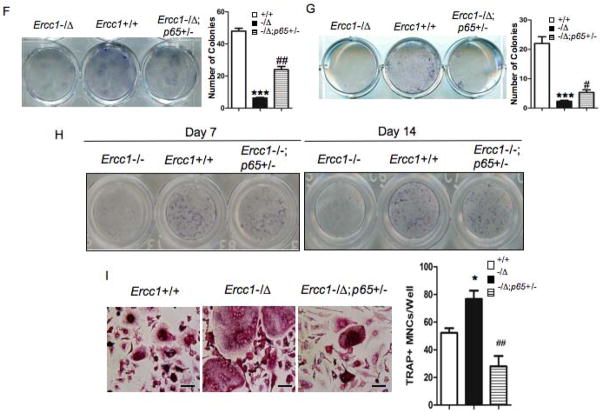
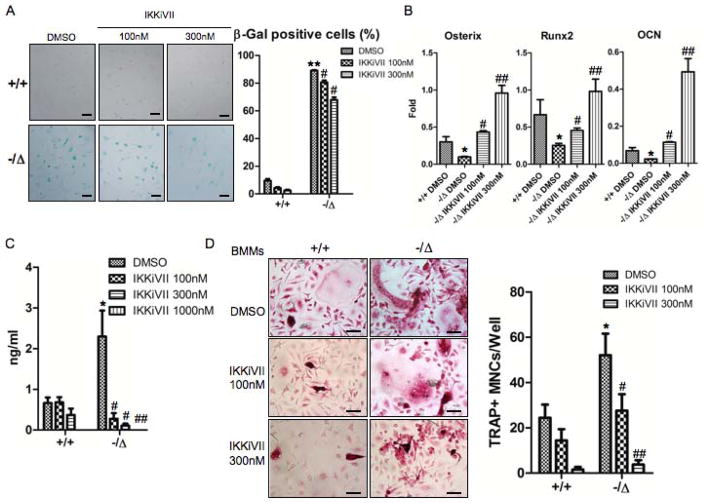
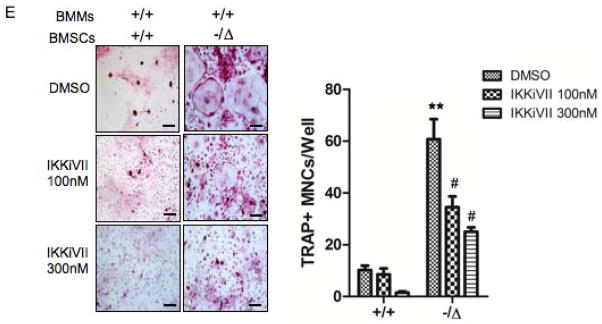
Advanced age is one of the most important risk factors for osteoporosis. Accumulation of oxidative DNA damage has been proposed to contribute to age-related deregulation of osteoblastic and osteoclastic cells. Excision repair cross complementary group 1-xeroderma pigmentosum group F (ERCC1-XPF) is an evolutionarily conserved structure-specific endonuclease that is required for multiple DNA repair pathways. Inherited mutations affecting expression of ERCC1-XPF cause a severe progeroid syndrome in humans, including early onset of osteopenia and osteoporosis, or anomalies in skeletal development. Herein, we used progeroid ERCC1-XPF-deficient mice, including Ercc1-null (Ercc1(-/-)) and hypomorphic (Ercc1(-/Δ)) mice, to investigate the mechanism by which DNA damage leads to accelerated bone aging. Compared to their wild-type littermates, both Ercc1(-/-) and Ercc1(-/Δ) mice display severe, progressive osteoporosis caused by reduced bone formation and enhanced osteoclastogenesis. ERCC1 deficiency leads to atrophy of osteoblastic progenitors in the bone marrow stromal cell (BMSC) population. There is increased cellular senescence of BMSCs and osteoblastic cells, as characterized by reduced proliferation, accumulation of DNA damage, and a senescence-associated secretory phenotype (SASP). This leads to enhanced secretion of inflammatory cytokines known to drive osteoclastogenesis, such as interleukin-6 (IL-6), tumor necrosis factor α (TNFα), and receptor activator of NF-κB ligand (RANKL), and thereby induces an inflammatory bone microenvironment favoring osteoclastogenesis. Furthermore, we found that the transcription factor NF-κB is activated in osteoblastic and osteoclastic cells of the Ercc1 mutant mice. Importantly, we demonstrated that haploinsufficiency of the p65 NF-κB subunit partially rescued the osteoporosis phenotype of Ercc1(-/Δ) mice. Finally, pharmacological inhibition of the NF-κB signaling via an I-κB kinase (IKK) inhibitor reversed cellular senescence and SASP in Ercc1(-/Δ) BMSCs. These results demonstrate that DNA damage drives osteoporosis through an NF-κB-dependent mechanism. Therefore, the NF-κB pathway represents a novel therapeutic target to treat aging-related bone disease.


Conflict of interest statement

Disclosure Page

All authors state that they have no conflicts of interest.

Figures

Fig. 1
Fig. 1. ERCC1 deficiency leads to severe, progressive osteoporosis in mice
(A) μQCT images (Left) and histomorphometric properties (Right) of lumbar vertebrae of 3-week-old WT (+/+) and Ercc1−/− mice. Upper panel, male WT (n=4) and Ercc1−/− (n=6). Lower panel, female WT (n=6) and Ercc1−/− (n=4). Scale bar, 200μm. (B) μQCT images (Left) and histomorphometric properties (Right) of lumbar vertebrae of 8-week-old (upper panels, n=4) and 22-week-old (lower panels, n=4) WT (+/+) and Ercc1−/Δmice. Scale bar, 200μm. (C) H&E analysis of tibia of 2-week-old WT (+/+) and Ercc1−/− mice. Scale bar, 100μm. (D) H&E of tibia of 8-week-old (left panels) and 22-week-old (right panels) WT (+/+) and Ercc1−/Δmice. Scale bar, 100μm. The number of osteoblasts per bone perimeter (Ob.N/B.pm) of 8-week-old WT (+/+) and Ercc1−/Δmice (n=4) is shown in the right panel. (E) Radiographic images of lumbar vertebrae of 22-week-old WT (+/+) and Ercc1−/Δmice. Scale bar, 1mm. All values are shown as mean ± SEM. * p < 0.05, ** p < 0.01, and *** p < 0.001.
Fig. 2
Fig. 2. ERCC1 deficiency leads to reduced bone formation and enhanced osteoclastogenesis
(A) Calcein double-labeling showing bone formation in 8-week-old (n=4) WT (+/+) (Upper panel) and Ercc1−/Δmice (Lower panel). Scale bar, 20μm. Bone formation rate (BFR) was calculated and presented in right panel. (B) TRAP staining of tibia sections of 8-week-old (n=4) WT (+/+) (Upper panels) and Ercc1−/Δmice (Lower panels). Scale bar, 50μm. The former animals displayed a significant increase in osteoclast surface/bone surface (%) and number of osteoclasts per bone perimeter (Oc.N/B.pm) (right panel, n=4). (C) TRAP staining of tibia sections of 2-week-old WT (+/+) and Ercc1−/− mice. Scale bar, 100μm. Osteoclast surface/bone surface (%) and Oc.N/B.pm were calculated for these animals (right panel, n=4) (D) TRAP staining of pBMMs of WT (+/+) and Ercc1−/Δmice cultured in osteoclastogenic medium in vitro (n=5). Scale bar, 50μm. (E) Quantitative RT-PCR analyses for mRNA levels of osteoclastic differentiation markers in pBMMs from WT and Ercc1−/Δmice (n=3). (F) pBMMs from WT and Ercc1−/Δmice were cultured on bovine cortical bone slices in osteoclastogenic medium for 15 days and stained for toluidine blue to visualize the resorption pits, the number of which in both animals were calculated and presented in the right panel (n=3). Scale bar, 50μm. The experiments in A–C and G were performed three times independently, and representative data are shown. All values are shown as mean ± SEM. **p < 0.01.
Fig. 3
Fig. 3. ERCC1 deficiency leads to atrophy of mesenchymal stem cells and compromises osteoblastic differentiation
(A) qRT-PCR analyses for expression of osteoblast markers Osx and Bsp in vertebrae extraction of 5-month-old (n=4) WT (+/+) and Ercc1−/Δmice. (B) Bone marrow CFU-F assays (hematoxylin staining) on bone marrow cells isolated from WT (+/+) mice and Ercc1−/Δlittermates. The CFU-F colonies were quantified (n=3). (C) Bone marrow CFU-ALP staining on bone marrow cells isolated from 8-week-old WT (+/+) and Ercc1−/Δlittermates. The CFU-ALP colonies were quantified (right panel, n=3). (D) Bone marrow CFU-OB assays (von-Kossa staining) on bone marrow cells isolated from 8-week-old WT (+/+) and Ercc1−/Δlittermates. Scale bar, 100μm. (E) qRT-PCR analysis of expression of osteoblast markers in adherent BMSCs of isolated from WT (+/+) mice and Ercc1−/− littermates (n=3). (F) ALP staining of WT (+/+) and Ercc1−/− BMSCs under osteogenic induction conditions for the indicated time periods (n=3). All experiments were performed three times independently, and representative data are shown. All values are shown as mean ± SEM. * p < 0.05, ** p < 0.01, and *** p < 0.001.
Fig. 4
Fig. 4. ERCC1 deficiency leads to increased DNA damage and cellular senescence in osteoblastic cells
(A) Immunofluorescent staining for γ-H2AX in cultures of WT (+/+) and Ercc1−/− primary calvarial osteoblasts. Scale bar, 20μm. (B) Staining of γ-H2AX in tibias from 8-week-old WT (+/+) mice and Ercc1−/Δlittermates. Scale bar, 50μm. (C) Staining for p-ATM in tibias of 8-week-old WT (+/+) mice and Ercc1−/Δlittermates. Scale bar, 100μm. (D) Staining for p16INK4A in tibias of 2-week-old WT (+/+) and Ercc1−/− mice. Scale bar, 50μm. (E) Ki67 staining of tibias from 8-week-old WT (+/+) and Ercc1−/Δlittermates. Scale bar, 50μm. (F) Western blot analysis demonstrating expression of cyclin D1 in vertebrae extracts of 5-month-old WT (+/+) mice and Ercc1−/Δlittermates. (G) Population doubling of WT (+/+) and Ercc1−/− primary calvarial osteoblasts. (H) Ki67 staining of primary calvarial osteoblasts isolated from 2-week-old WT (+/+) mice and Ercc1−/− littermates at passage 3 (Upper panel) and passage 6 (Lower panel). The percentage of Ki67 positive cells was quantified (Right panels). Scale bar, 100μm. (I) SA-β-gal staining of BMSCs from 4-week-old WT (+/+) mice and Ercc1−/Δlittermates at passage 2. Scale bar, 50μm. The percentage of positive cells was quantified (Right panel, n=4). All experiments were performed three times independently, and representative data are shown. The values are shown as mean ± SEM. *** p < 0.001.
Fig. 5
Fig. 5. ERCC1 deficiency triggers SASP and induces an inflammatory microenvironment favoring bone resorption
(A) ELISA analysis for IL-6 secretion in the conditioned medium of BMSCs of WT (+/+) and Ercc1−/Δmice. BMSCs were cultured with osteogenic media for 0 or 7 days, respectively. ** p < 0.01 by Student’s t-test. (B) ELISA analyses for the serum levels of IL-6, TNFα, RANKL and OPG of WT (+/+) and Ercc1-deficient mice (n=9). * p < 0.05, ** p < 0.01, and ** p < 0.001 by Student’s t-test. (C) ELISA analysis for IL-6 and TNF-α secretion from WT (+/+) and Ercc1−/ΔBMSCs that were transduced with lentiviruses expressing either empty vector (EV) or Ercc1. * p < 0.05 and ** p < 0.01 compared with +/+ GFP, and # p < 0.05 compared with Ercc1−/Δcells transduced with EV. (D) pBMMs-BMSCs co-culture assays. pBMSCs from WT (+/+) and Ercc1−/Δmice were transduced with lentiviruses expressing either empty vector (EV) or Flag-mErcc1. Then the infected BMSCs were co-cultured with WT (+/+) BMMs in osteoclastogenic differentiation media for 7–8 days prior to TRAP staining for TRAP+ mononuclear cells (MNCs). Scale bar, 50μm. ** p < 0.01 compared to WT (+/+) BMSCs with EV expression and # p < 0.05 compared to Ercc1−/ΔBMSCs with EV expression. All experiments were performed three times independently, and representative data are shown. All values are shown as mean ± SEM.
Fig. 6
Fig. 6. NF-κB is activated in primary osteoblasts, BMSCs and primary bone marrow macrophages from osteoporotic ERCC1-deficient mice
(A) Western blot analysis demonstrating protein levels of IκBα and phospho-IκBα in primary calvarial osteoblasts isolated from 1-week-old WT (+/+) and Ercc1−/− mice with osteogenic induction for either 0 or 7 days, respectively. β-actin served as a loading control. (B) Immunostaining of p65 in primary calvarial osteoblasts of 1-week-old WT (+/+) and Ercc1−/− mice. Cells were treated with TNFα for either 0 (Upper panel) or 60 minutes (Lower panel). Scale bar, 50μm. (C) Western blot analysis demonstrating protein levels of phospho- and total p65 in WT (+/+) and Ercc1−/Δprimary BMSCs with 7-day osteogenic induction. β-actin served as a loading control. (D) Western blot analysis demonstrating protein levels of phospho- (S85), total IKKγ as well as ATM in WT (+/+) and Ercc1−/ΔpBMSCs. (E) Western blot analysis demonstrating protein levels of phospho- (S85) and total IKKγ in WT (+/+) and Ercc1−/Δprimary BMMs. (F) Western blot analysis demonstrating protein levels of phospho- and total p65 in WT (+/+) and Ercc1−/Δprimary BMMs. The cells were cultured in proliferation medium for 3 days, and then treated with RANKL for the indicated time periods prior to being harvested. β-actin served as a loading control. All experiments were performed three times independently, and representative data are shown.
Fig. 7
Fig. 7. Heterozygous deletion of the p65 subunit rescues osteoporosis
(A–C) μQCT images (A) and histomorphometric analyses (B & C) on tibia (Upper panels) and lumbar vertebrae (Lower panels) from 15-week-old WT (+/+), Ercc1−/Δ, and Ercc1−/Δ;p65+/− age-matched mice (n=3). (D) Visual (left) and quantitative (right) presentations of senescence-associated β-galactosidase staining of BMSCs isolated from 15-week-old WT (+/+), Ercc1−/Δand Ercc1−/Δp65+/− mice at passage 2 (n=4). Scale bar, 100μm. (E) The effects of p65 haploinsufficiency on serum levels of IL-6 (right) and TNFα (left) of 10-week- old Ercc1−/Δmice (n=3), as determined by ELISA assays. (F) Bone marrow CFU-F assays for WT (+/+) and Ercc1−/Δ, Ercc1−/Δp65+/− mice. The number of nodules was quantified (Right panel, n=3). (G) Bone marrow CFU-ALP assays for WT (+/+), Ercc1−/Δ, and Ercc1−/Δp65+/− mice. The number of nodules was quantified (Right panel, n=4). (H) ALP staining of BMSCs isolated from 3-week-old WT (+/+), Ercc1−/−, Ercc1−/− p65+/− mice with osteogenic induction for either 7 or 14 days (n=3). (I) Visual and quantitative presentations of TRAP staining of pBMMs isolated from 15-week-old WT (+/+), Ercc1−/Δ, and Ercc1−/Δp65+/− mice. The cells were cultured in osteoclastogenic medium for 6 days (n=5). Scale bar, 50μm. The experiments were performed at least three times independently, and representative data are shown. All values are shown as mean ± SEM. * p < 0.05, ** p < 0.01, *** p < 0.001 compared with WT and # p < 0.05, ## p < 0.01 compared with Ercc1−/Δ.
Fig. 8
Fig. 8. Pharmacological inhibition of the NF-κB activation rescues the osteoblast and osteoclast defects of ERCC1-deficient mice
(A) Senescence-associated β-galactosidase staining of WT (+/+) and Ercc1−/ΔBMSCs that were treated with DMSO (vehicle), or the inhibitor of NF-κB activation IKKiVII (100nM, or 300nM) for 3 days. The percent of positive cells was counted (Right panel, n=4). Scale bar, 100μm. (B) qRT-PCR analysis of expression of osteoblastic markers in WT (+/+) and Ercc1−/ΔBMSCs. The cells were cultured in osteogenic media with DMSO, or 100nM, or 300nM IKKiVII for 7 days before harvesting for RNA isolation (n=4). (C) ELISA analysis showing IL-6 secretion from BMSCs isolated from 8-week-old WT (+/+) and Ercc1−/Δmice. The cells were treated with DMSO or 100nM or 300nM IKKiVII for 3 days. Conditioned media was then harvested for ELISA analysis (n=4). (D) TRAP staining of WT (+/+) and Ercc1−/ΔBMMs. The cells were cultured in osteoclastogenic media with DMSO or 100nM or 300nM IKKiVII treatment for 6 days prior to TRAP staining (n=5). Scale bar, 50μm. (E) pBMMs-BMSCs co-culture assays. Primary BMSCs from 4-week-old WT (+/+) and Ercc1−/Δmice were co-cultured with WT (+/+) BMMs for 7–8 days with either DMSO or 100nM or 300nM IKKiVII. The number of TRAP+ MNCs per well was counted (n=5). Scale bar, 100μm. All experiments were performed three times independently, and representative data are shown. All values are shown as mean ± SEM. * p < 0.05 compared to +/+ with DMSO, # p < 0.05 and ## p < 0.01 compared to Ercc1−/Δwith DMSO.

References

    1. Rachner TD, Khosla S, Hofbauer LC. Osteoporosis: now and the future. Lancet. 2011;377(9773):1276–87. - PMC - PubMed
    1. Cheung CL, Xiao SM, Kung AW. Genetic epidemiology of age-related osteoporosis and its clinical applications. Nat Rev Rheumatol. 2010;6(9):507–17. - PubMed
    1. Zhang W, Ou G, Hamrick M, Hill W, Borke J, Wenger K, Chutkan N, Yu J, Mi QS, Isales CM, Shi XM. Age-related changes in the osteogenic differentiation potential of mouse bone marrow stromal cells. J Bone Miner Res. 2008;23(7):1118–28. - PMC - PubMed
    1. Stewart SA, Weinberg RA. Telomeres: cancer to human aging. Annu Rev Cell Dev Biol. 2006;22:531–57. - PubMed
    1. Hoeijmakers JH. DNA damage, aging, and cancer. N Engl J Med. 2009;361(15):1475–85. - PubMed

Publication types