. 2014 Mar;35(3):993-1003.
doi: 10.1002/hbm.22229. Epub 2012 Dec 26.

Spatial variability and changes of metabolite concentrations in the cortico-spinal tract in multiple sclerosis using coronal CSI

Affiliations

Spatial variability and changes of metabolite concentrations in the cortico-spinal tract in multiple sclerosis using coronal CSI

Carmen Tur et al. Hum Brain Mapp. 2014 Mar.

Abstract

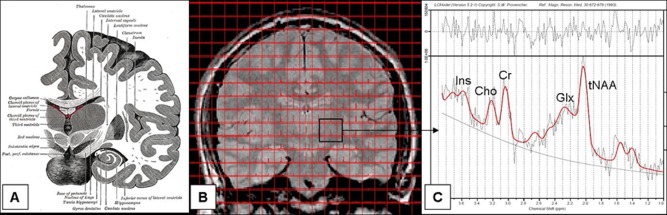
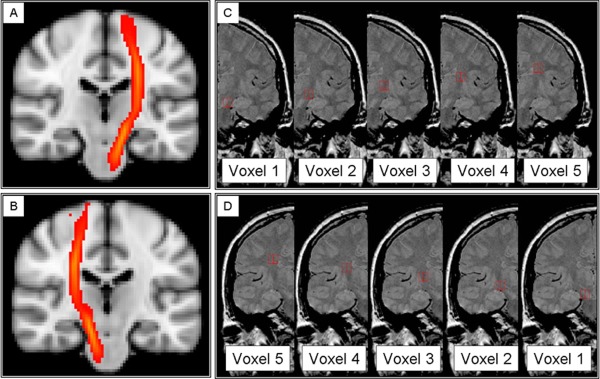
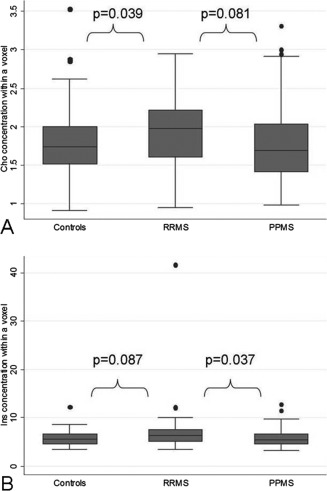
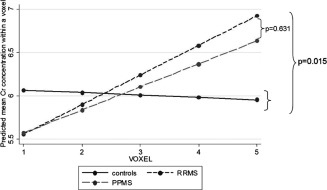
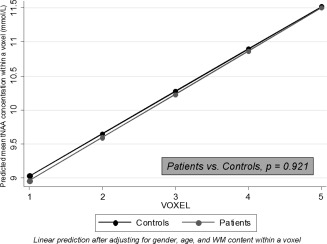
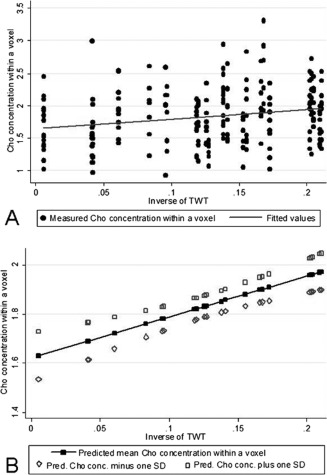
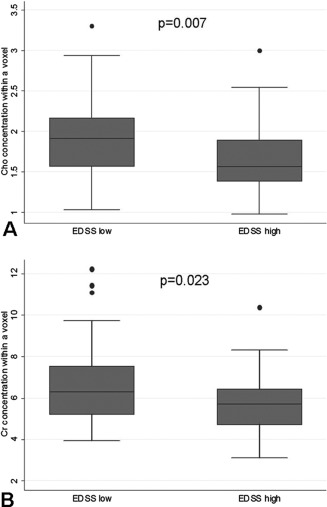
We characterized metabolic changes along the cortico-spinal tract (CST) in multiple sclerosis (MS) patients using a novel application of chemical shift imaging (CSI) and considering the spatial variation of metabolite levels. Thirteen relapsing-remitting (RR) and 13 primary-progressive (PP) MS patients and 16 controls underwent (1)H-MR CSI, which was applied to coronal-oblique scans to sample the entire CST. The concentrations of the main metabolites, i.e., N-acetyl-aspartate, myo-Inositol (Ins), choline containing compounds (Cho) and creatine and phosphocreatine (Cr), were calculated within voxels placed in regions where the CST is located, from cerebral peduncle to corona radiata. Differences in metabolite concentrations between groups and associations between metabolite concentrations and disability were investigated, allowing for the spatial variability of metabolite concentrations in the statistical model. RRMS patients showed higher CST Cho concentration than controls, and higher CST Ins concentration than PPMS, suggesting greater inflammation and glial proliferation in the RR than in the PP course. In RRMS, a significant, albeit modest, association between greater Ins concentration and greater disability suggested that gliosis may be relevant to disability. In PPMS, lower CST Cho and Cr concentrations correlated with greater disability, suggesting that in the progressive stage of the disease, inflammation declines and energy metabolism reduces. Attention to the spatial variation of metabolite concentrations made it possible to detect in patients a greater increase in Cr concentration towards the superior voxels as compared to controls and a stronger association between Cho and disability, suggesting that this step improves our ability to identify clinically relevant metabolic changes.

Keywords: MRI; MRS; multiple sclerosis.


Figures

Figure 1
Figure 1
Chemical shift imaging grid covering the entire CST on a single image shown together with a schematic picture of the anatomy of the CST and a spectrum. (A) Coronal brain image, from the 20th U.S. edition of Gray's Anatomy of the Human Body (20th edition, thoroughly revised and re‐edited by Warren H. Lewis, Illustrated with 1247 engravings. Philadelphia: Lea & Febiger, 1918, published in 1918); (B) CSI grid covering the entire CST on a single (FSE) image. This grid shows the original location of voxels; (C) Spectrum from the voxel located above the left cerebral peduncle in a healthy control. CSI, Chemical shift imaging; tNAA, N‐acetylaspartate and N‐acetlylaspartylglutamate; Glx, glutamate plus glutamine (data not reported); Cr, creatine and phosphocreatine; Cho, choline‐containing compounds; Ins, myo‐inositol.
Figure 2
Figure 2
Voxels extracted from the spectroscopic grid to obtain concentrations of metabolites along the cortico‐spinal tract. (A and B) Probability map of the left and right cortico‐spinal tracts, provided by the JHU white matter tractography atlas (http://www.fmrib.ox.ac.uk/fsl), which were used, together with the individual T1 images, as reference images to identify and position the voxels along the CST. (C and D) Spectroscopic voxels (in white, 1 = cerebral peduncle, 2 = above cerebral peduncle, 3 = internal capsule, 4 = above internal capsule, 5 = corona radiata) selected in the left (C) and right (D) white matter in regions where the CST is known to be located, from the cerebral peduncle to the corona radiata, overlaid onto coronal PD images.
Figure 3
Figure 3
Differences in Cho and Ins between patients and controls. (A) A significantly lower concentration (in mmol/l) of Cho was seen in controls when compared to RRMS, and (B) lower Ins (in mmol/l) was seen in PPMS when compared to RRMS. RRMS, relapsing‐remitting multiple sclerosis; PPMS, primary progressive multiple sclerosis; Cho, Choline containing compounds (Cho); Ins, Myo‐Inositol.
Figure 4
Figure 4
Differences between patients and controls in the slope of Cr along the CST. Both groups of patients showed a significant increase of Cr concentration (in mmol/l) towards the upper parts of the CST (for RRMS: P = 0.007; for PPMS: P = 0.017), whereas controls did not show such increase (P = 0.791). The slope of Cr significantly differed between patients and controls (P = 0.015), whilst it did not change between RRMS and PPMS (P = 0.631).
Figure 5
Figure 5
Predicted tNAA concentrations within a voxel. Both patients and controls showed a significant increase of tNAA concentration (in mmol/l) towards the upper parts of the CST after adjusting for age, gender, and WM content within a voxel (patients: P < 0.001; controls: P < 0.001). However, this increase was not significantly different between patients and controls. Voxel location: 1 = cerebral peduncle, 2 = above cerebral peduncle, 3 = internal capsule, 4 = above internal capsule, 5 = corona radiata. CI, confidence interval; CST, cortico‐spinal tract; RC, regression coefficient; t‐NAA, N‐acetyl‐aspartate plus N‐acetyl‐aspartyl‐glutamate; WM, white matter.
Figure 6
Figure 6
Association between Cho concentration in the CST and ability to walk before and after adjusting for the spatial variability of Cho concentrations along the CST. Patients with reduced ability to walk (as measured byt the inverse of TWT) showed lower concentrations of Cho (in mmol/l) in the CST (P = 0.019); (A) shows this relationship using the raw, unadjusted concentrations of Cho; (B) shows this relationship using the predicted mean Cho concentrations (± one SD) after adjusting for age, gender, tissue fractions, and spatial variation (voxel location and side).
Figure 7
Figure 7
Association between metabolite concentrations and disability. PPMS patients with higher disability (as measured by the EDSS) showed lower concentrations of Cho (A) and Cr (B) in the CST (see text for more details on these relationships). Here, values of Cr and Cho concentrations refer to those obtained considering all CST voxels (left and right). All concentrations are expressed in mmol/l.

Similar articles

Cited by

References

    1. Armitage P, Berry G, Matthews J (2002): Statistical methods in medical research, 4th ed. Blackwell Science Ltd.
    1. Barker PB, Bonekamp D, Riedy G, Smith M (2006): Quantitation of NAA in the brain by magnetic resonance spectroscopy. Adv Exp Med Biol 576:183–197. - PubMed
    1. Bitsch A, Bruhn H, Vougioukas V, Stringaris A, Lassmann H, Frahm J, Bruck W (1999): Inflammatory CNS demyelination: histopathologic correlation with in vivo quantitative proton MR spectroscopy. AJNR Am J Neuroradiol 20:1619–1627. - PMC - PubMed
    1. Bodini B, Khaleeli Z, Cercignani M, Miller DH, Thompson AJ, Ciccarelli O (2009): Exploring the relationship between white matter and gray matter damage in early primary progressive multiple sclerosis: An in vivo study with TBSS and VBM. Hum Brain Mapp 30:2852–2861. - PMC - PubMed
    1. Bramow S, Frischer JM, Lassmann H, Koch‐Henriksen N, Lucchinetti CF, Sorensen PS, Laursen H (2010): Demyelination versus remyelination in progressive multiple sclerosis. Brain 133:2983–2998. - PubMed

Publication types