

Functional relevance of dynamic properties of Dimeric NADP-dependent Isocitrate Dehydrogenases
- PMID: 23281650
- PMCID: PMC3521221
- DOI: 10.1186/1471-2105-13-S17-S2
Functional relevance of dynamic properties of Dimeric NADP-dependent Isocitrate Dehydrogenases
Abstract
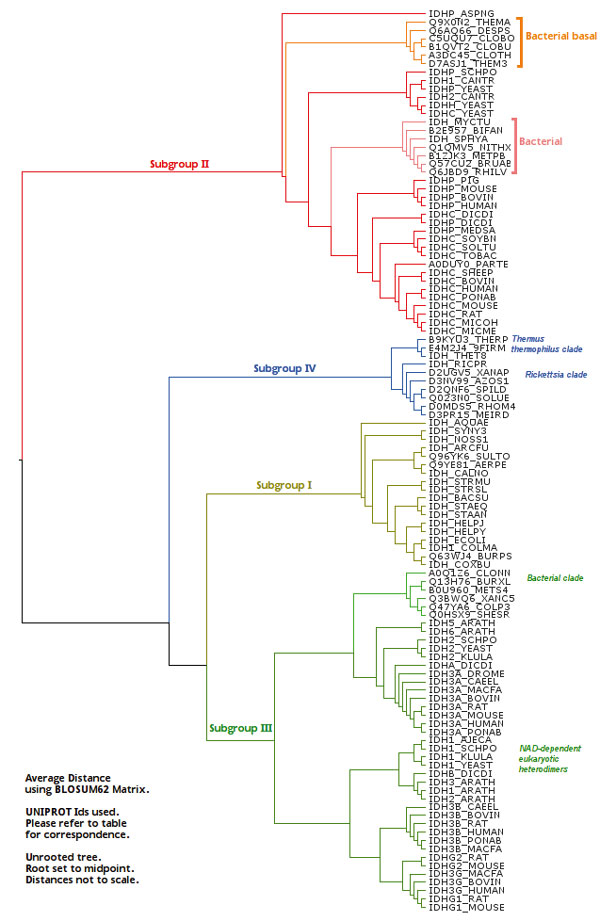
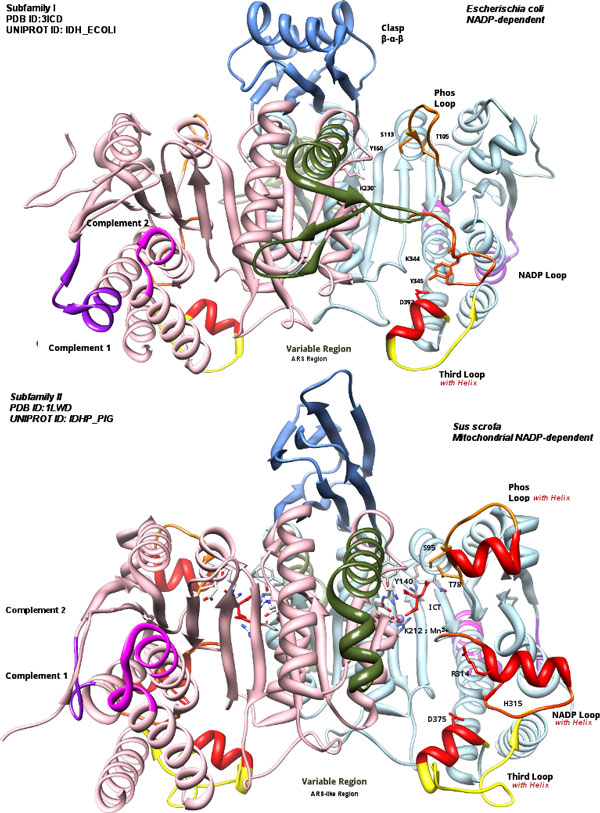
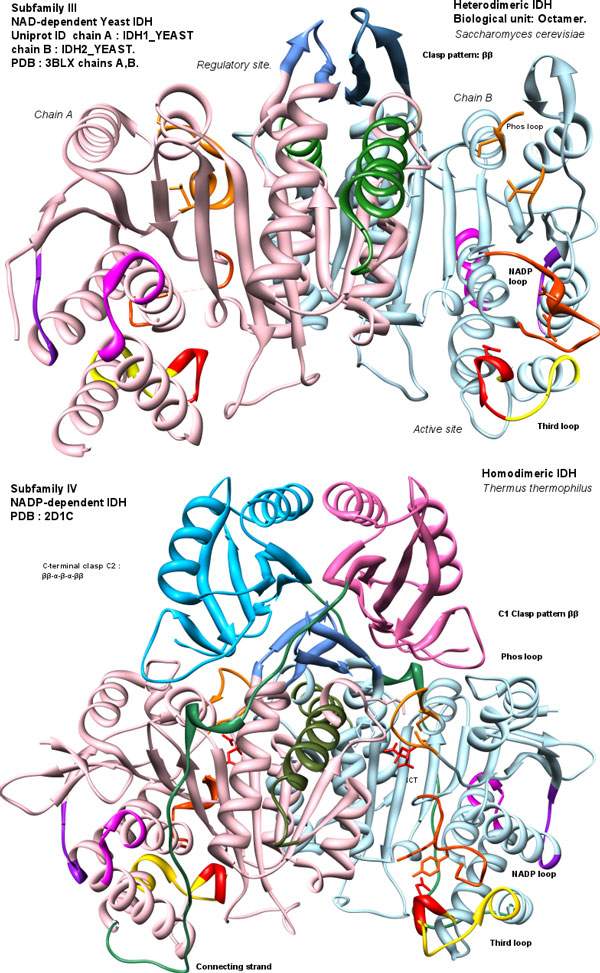
Background: Isocitrate Dehydrogenases (IDHs) are important enzymes present in all living cells. Three subfamilies of functionally dimeric IDHs (subfamilies I, II, III) are known. Subfamily I are well-studied bacterial IDHs, like that of Escherischia coli. Subfamily II has predominantly eukaryotic members, but it also has several bacterial members, many being pathogens or endosymbionts. subfamily III IDHs are NAD-dependent. The eukaryotic-like subfamily II IDH from pathogenic bacteria such as Mycobacterium tuberculosis IDH1 are expected to have regulation similar to that of bacteria which use the glyoxylate bypass to survive starvation. Yet they are structurally different from IDHs of subfamily I, such as the E. coli IDH.
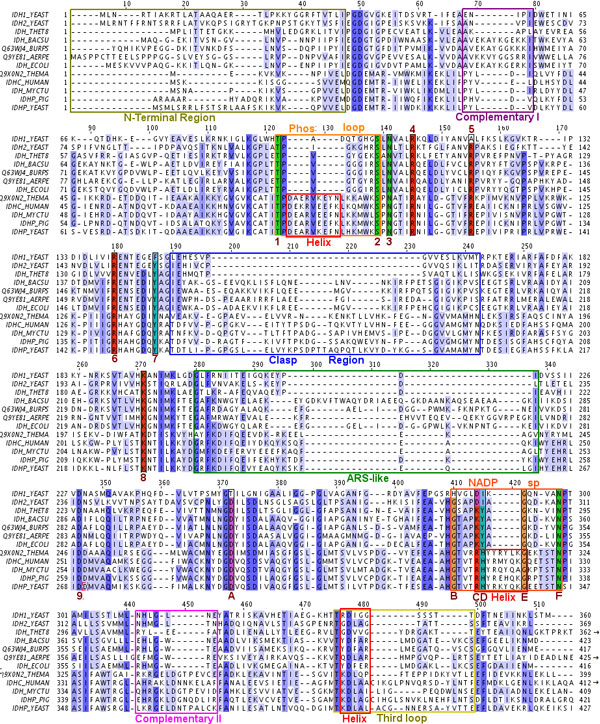
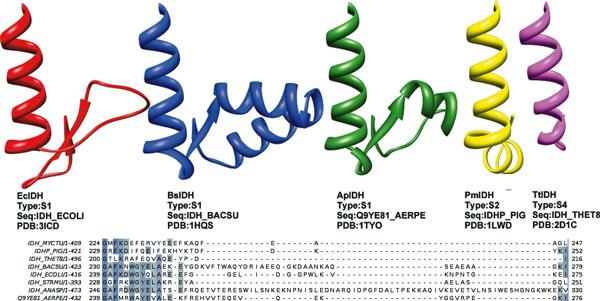
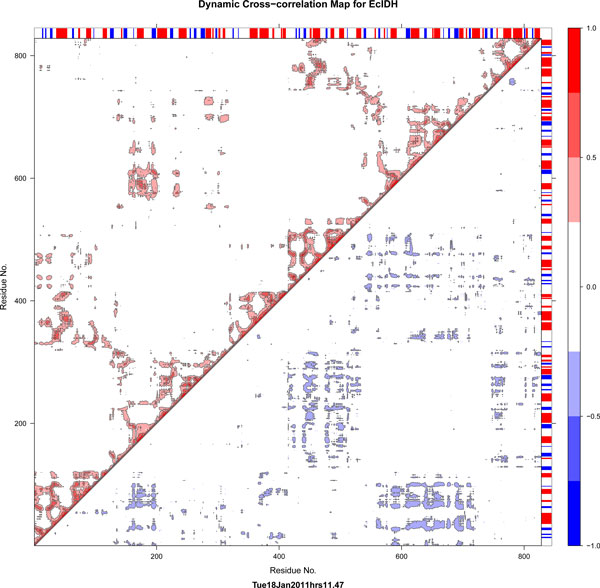
Results: We have used phylogeny, structural comparisons and molecular dynamics simulations to highlight the similarity and differences between NADP-dependent dimeric IDHs with an emphasis on regulation. Our phylogenetic study indicates that an additional subfamily (IV) may also be present. Variation in sequence and structure in an aligned region may indicate functional importance concerning regulation in bacterial subfamily I IDHs. Correlation in movement of prominent loops seen from molecular dynamics may explain the adaptability and diversity of the predominantly eukaryotic subfamily II IDHs.
Conclusion: This study discusses possible regulatory mechanisms operating in various IDHs and implications for regulation of eukaryotic-like bacterial IDHs such as that of M. tuberculosis, which may provide avenues for intervention in disease.
Figures


Similar articles
-
Two phylogenetically divergent isocitrate dehydrogenases are encoded in Leishmania parasites. Molecular and functional characterization of Leishmania mexicana isoenzymes with specificity towards NAD+ and NADP.Mol Biochem Parasitol. 2020 Nov;240:111320. doi: 10.1016/j.molbiopara.2020.111320. Epub 2020 Sep 24. Mol Biochem Parasitol. 2020. PMID: 32980452
-
Crystal structures of NAD+-linked isocitrate dehydrogenase from the green alga Ostreococcus tauri and its evolutionary relationship with eukaryotic NADP+-linked homologs.Arch Biochem Biophys. 2021 Sep 15;708:108898. doi: 10.1016/j.abb.2021.108898. Epub 2021 May 3. Arch Biochem Biophys. 2021. PMID: 33957092
-
Crystal structure of the monomeric isocitrate dehydrogenase in the presence of NADP+: insight into the cofactor recognition, catalysis, and evolution.J Biol Chem. 2003 Sep 19;278(38):36897-904. doi: 10.1074/jbc.M304091200. Epub 2003 Jul 10. J Biol Chem. 2003. PMID: 12855708
-
Isocitrate dehydrogenase mutations in gliomas: mechanisms, biomarkers and therapeutic target.Curr Opin Neurol. 2011 Dec;24(6):648-52. doi: 10.1097/WCO.0b013e32834cd415. Curr Opin Neurol. 2011. PMID: 22002076 Free PMC article. Review.
-
Molecular insights into the catalysis and regulation of mammalian NAD-dependent isocitrate dehydrogenases.Curr Opin Struct Biol. 2023 Oct;82:102672. doi: 10.1016/j.sbi.2023.102672. Epub 2023 Aug 3. Curr Opin Struct Biol. 2023. PMID: 37542909 Review.
Cited by
-
The regulatory mechanisms and inhibitors of isocitrate dehydrogenase 1 in cancer.Acta Pharm Sin B. 2023 Apr;13(4):1438-1466. doi: 10.1016/j.apsb.2022.12.019. Epub 2023 Feb 2. Acta Pharm Sin B. 2023. PMID: 37139412 Free PMC article. Review.
-
InCoB2012 Conference: from biological data to knowledge to technological breakthroughs.BMC Bioinformatics. 2012;13 Suppl 17(Suppl 17):S1. doi: 10.1186/1471-2105-13-S17-S1. Epub 2012 Dec 13. BMC Bioinformatics. 2012. PMID: 23281929 Free PMC article.
-
Molecular Pathogenesis of Low-Grade Glioma.Neurosurg Clin N Am. 2019 Jan;30(1):17-25. doi: 10.1016/j.nec.2018.08.011. Neurosurg Clin N Am. 2019. PMID: 30470401 Free PMC article. Review.
-
An acidic residue buried in the dimer interface of isocitrate dehydrogenase 1 (IDH1) helps regulate catalysis and pH sensitivity.Biochem J. 2020 Aug 28;477(16):2999-3018. doi: 10.1042/BCJ20200311. Biochem J. 2020. PMID: 32729927 Free PMC article.
-
Novel type II and monomeric NAD+ specific isocitrate dehydrogenases: phylogenetic affinity, enzymatic characterization, and evolutionary implication.Sci Rep. 2015 Mar 16;5:9150. doi: 10.1038/srep09150. Sci Rep. 2015. PMID: 25775177 Free PMC article.
References
-
- Yasutake Y, Watanabe S, Yao M, Takada Y, Fukunaga N, Tanaka I. Crystal structure of the monomeric isocitrate dehydrogenase in the presence of NADP+: insight into the cofactor recognition, catalysis, and evolution. The Journal of biological chemistry. 2003;278:36897–904. doi: 10.1074/jbc.M304091200. - DOI - PubMed
-
- Banerjee S, Nandyala A, Podili R, Katoch VM, Hasnain SE. Comparison of Mycobacterium tuberculosis isocitrate dehydrogenases (ICD-1 and ICD-2) reveals differences in coenzyme affinity, oligomeric state, pH tolerance and phylogenetic affiliation. BMC biochemistry. 2005;6:20. doi: 10.1186/1471-2091-6-20. - DOI - PMC - PubMed
Publication types
MeSH terms
Substances
LinkOut - more resources
Full Text Sources
Miscellaneous
