

ARG-based genome-wide analysis of cacao cultivars
- PMID: 23281769
- PMCID: PMC3526434
- DOI: 10.1186/1471-2105-13-S19-S17
ARG-based genome-wide analysis of cacao cultivars
Abstract
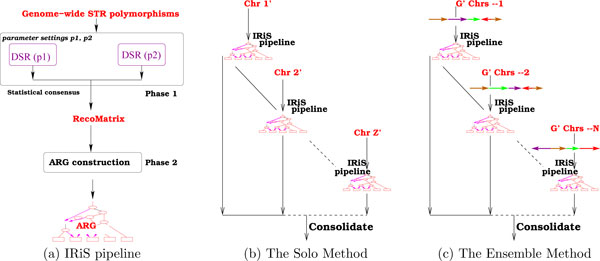
Background: Ancestral recombinations graph (ARG) is a topological structure that captures the relationship between the extant genomic sequences in terms of genetic events including recombinations. IRiS is a system that estimates the ARG on sequences of individuals, at genomic scales, capturing the relationship between these individuals of the species. Recently, this system was used to estimate the ARG of the recombining X Chromosome of a collection of human populations using relatively dense, bi-allelic SNP data.
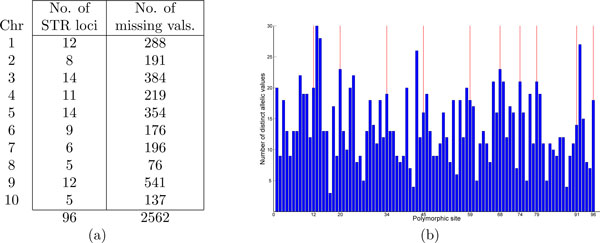
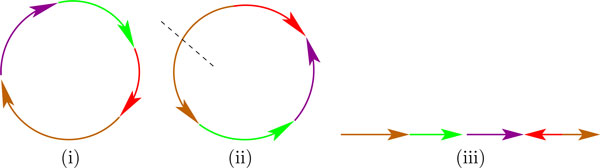
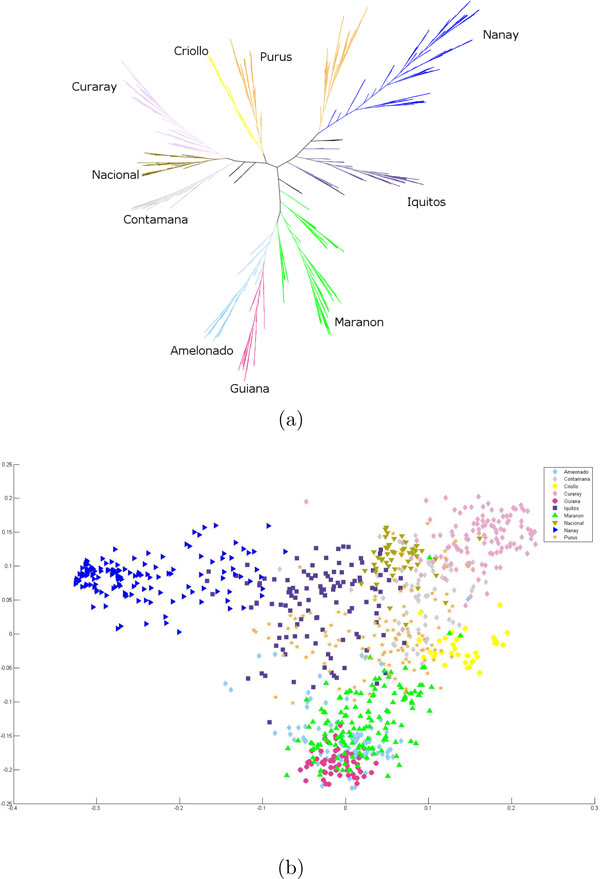
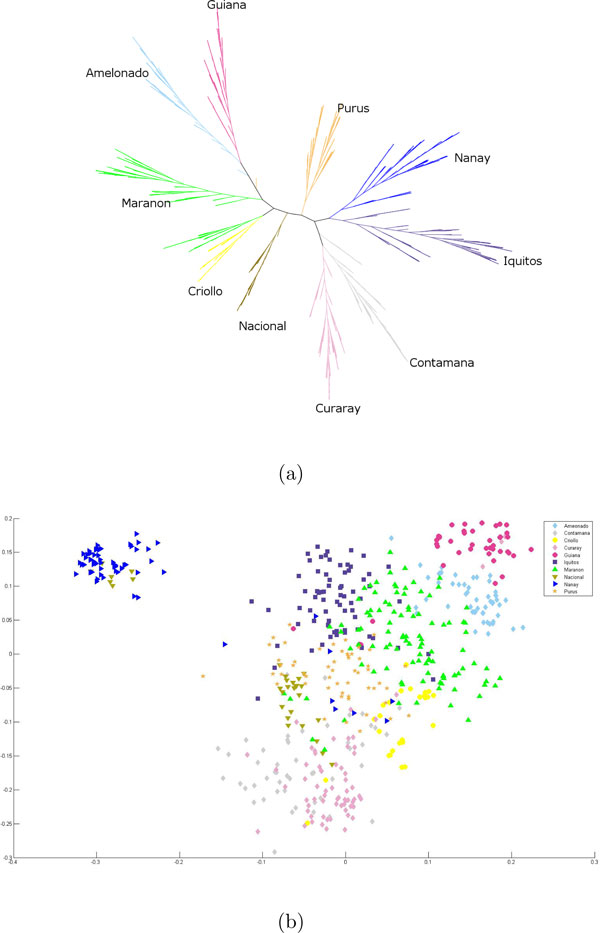
Results: While the ARG is a natural model for capturing the inter-relationship between a single chromosome of the individuals of a species, it is not immediately apparent how the model can utilize whole-genome (across chromosomes) diploid data. Also, the sheer complexity of an ARG structure presents a challenge to graph visualization techniques. In this paper we examine the ARG reconstruction for (1) genome-wide or multiple chromosomes, (2) multi-allelic and (3) extremely sparse data. To aid in the visualization of the results of the reconstructed ARG, we additionally construct a much simplified topology, a classification tree, suggested by the ARG.As the test case, we study the problem of extracting the relationship between populations of Theobroma cacao. The chocolate tree is an outcrossing species in the wild, due to self-incompatibility mechanisms at play. Thus a principled approach to understanding the inter-relationships between the different populations must take the shuffling of the genomic segments into account. The polymorphisms in the test data are short tandem repeats (STR) and are multi-allelic (sometimes as high as 30 distinct possible values at a locus). Each is at a genomic location that is bilaterally transmitted, hence the ARG is a natural model for this data. Another characteristic of this plant data set is that while it is genome-wide, across 10 linkage groups or chromosomes, it is very sparse, i.e., only 96 loci from a genome of approximately 400 megabases. The results are visualized both as MDS plots and as classification trees. To evaluate the accuracy of the ARG approach, we compare the results with those available in literature.
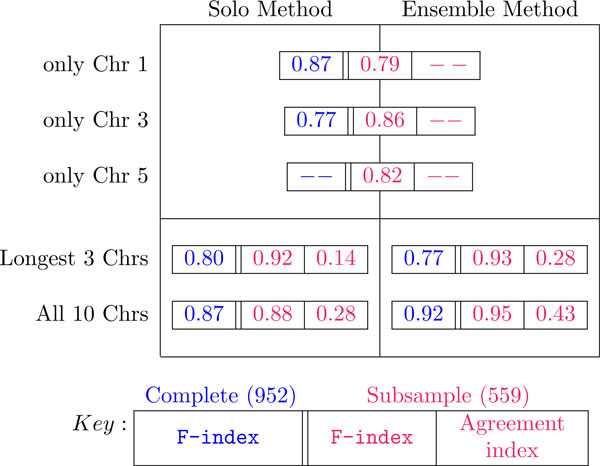
Conclusions: We have extended the ARG model to incorporate genome-wide (ensemble of multiple chromosomes) data in a natural way. We present a simple scheme to implement this in practice. Finally, this is the first time that a plant population data set is being studied by estimating its underlying ARG. We demonstrate an overall precision of 0.92 and an overall recall of 0.93 of the ARG-based classification, with respect to the gold standard. While we have corroborated the classification of the samples with that in literature, this opens the door to other potential studies that can be made on the ARG.
Figures
References
-
- Bartley BGD. The genetic diversity of cacao and its utilization. CABI Pub; 2005.
-
- Laurent V, Risterucci AM, Lanaud C. Genetic diversity in cocoa revealed by cDNA probes. TAG Theoretical and Applied Genetics. 1994;88:193–198. - PubMed
-
- Lerceteau E, Robert T, Pétiard V, Crouzillat D. Evaluation of the extent of genetic variability among Theobroma cacao accessions using RAPD and RFLP markers. TAG Theoretical and Applied Genetics. 1997;95:10–19. doi: 10.1007/s001220050527. - DOI
-
- Sereno M, Albuquerque P, Vencovsky R, Figueira A. Genetic Diversity and Natural Population Structure of Cacao (Theobroma cacao L.) from the Brazilian Amazon Evaluated by Microsatellite Markers. Conservation Genetics. 2006;7:13–24. doi: 10.1007/s10592-005-7568-0. - DOI
Publication types
MeSH terms
LinkOut - more resources
Full Text Sources
Research Materials
Miscellaneous
