Review
. 2013 May;280(10):2399-417.
doi: 10.1111/febs.12109. Epub 2013 Feb 6.

Proteoglycans and their roles in brain cancer

Affiliations
Review

Proteoglycans and their roles in brain cancer

Anna Wade et al. FEBS J. 2013 May.

Abstract

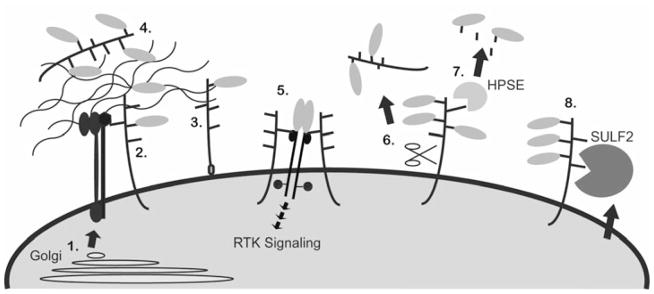
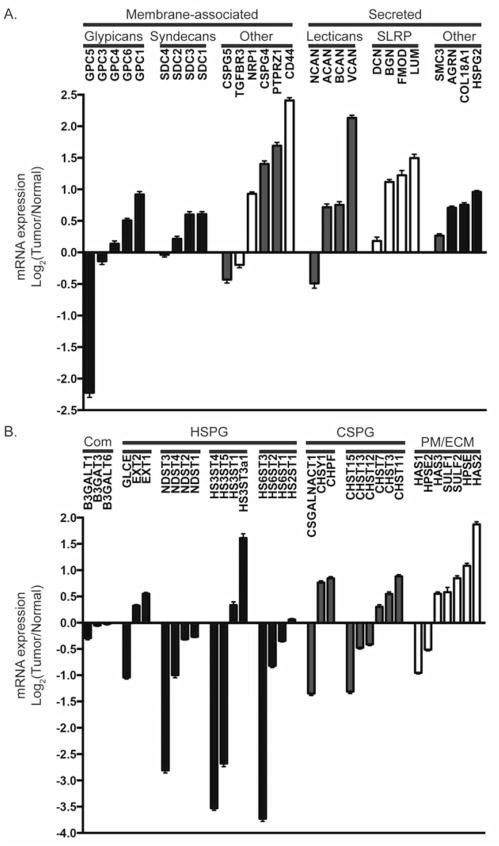
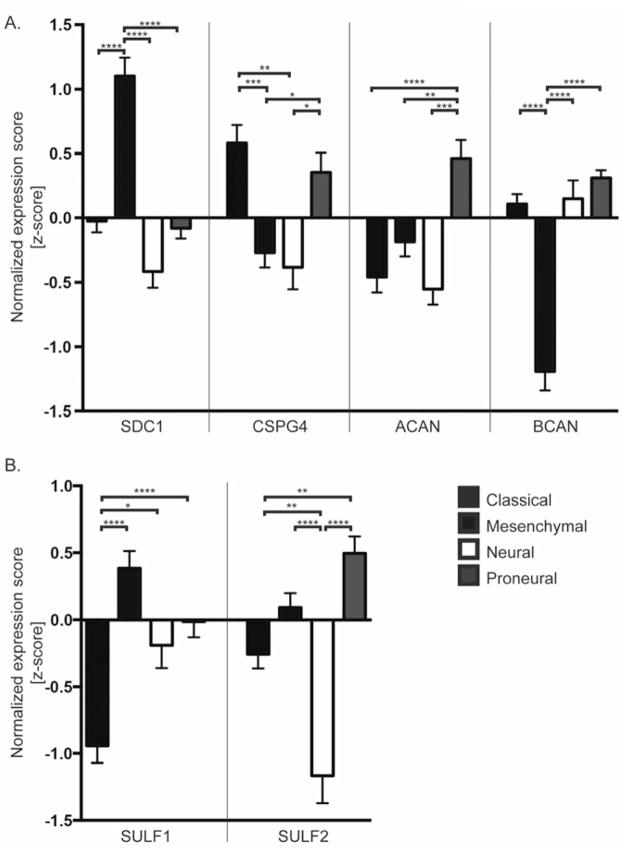
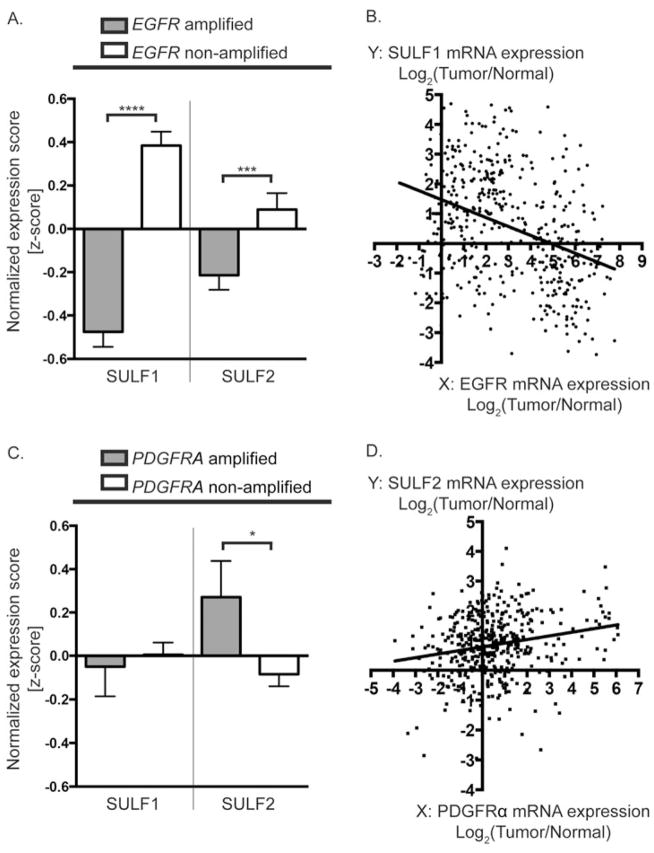
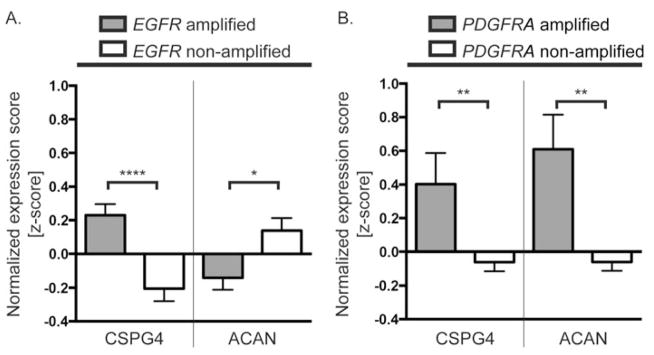
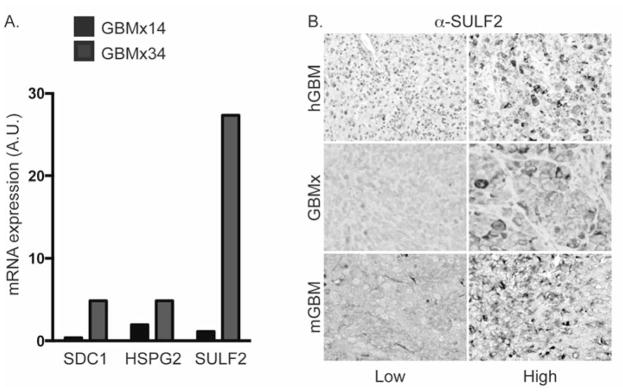
Glioblastoma, a malignant brain cancer, is characterized by abnormal activation of receptor tyrosine kinase signalling pathways and a poor prognosis. Extracellular proteoglycans, including heparan sulfate and chondroitin sulfate, play critical roles in the regulation of cell signalling and migration via interactions with extracellular ligands, growth factor receptors and extracellular matrix components, as well as intracellular enzymes and structural proteins. In cancer, proteoglycans help drive multiple oncogenic pathways in tumour cells and promote critical tumour-microenvironment interactions. In the present review, we summarize the evidence for proteoglycan function in gliomagenesis and examine the expression of proteoglycans and their modifying enzymes in human glioblastoma using data obtained from The Cancer Genome Atlas (http://cancergenome.nih.gov/). Furthermore, we demonstrate an association between specific proteoglycan alterations and changes in receptor tyrosine kinases. Based on these data, we propose a model in which proteoglycans and their modifying enzymes promote receptor tyrosine kinase signalling and progression in glioblastoma, and we suggest that cancer-associated proteoglycans are promising biomarkers for disease and therapeutic targets.


Conflict of interest statement

Conflict of interest

The authors declare they have no conflict of interest.

Figures

Figure 1
Figure 1. Schematic depicting proteoglycan cellular localization and extracellular modification
Proteoglycans are post-translationally modified in the Golgi (1) and transported to the plasma membrane where they can remain tethered to the plasma membrane, via a transmembrane domain (2) or a GPI-link (3), or be secreted (4). Extracellular proteoglycans can sequester ligands, such as growth factors and morphogens (green ovals), and bind matrix proteins (4). Transmembrane and GPI-linked proteoglycans can facilitate cell adhesion by interacting with the ECM and with integrins (red and blue structure), or they can act as co-receptors to stabilize ligand-receptor complexes and promote RTK signaling (5). Once in the extracellular environment proteoglycans can be further modified enzymatically. Sheddases can cleave the core protein to generate a soluble fragment (6), HPSE cleaves HS chains to release biologically active GAG chains (7), and the SULFs remove 6O-sulfates from HS (8).
Figure 2
Figure 2. Proteoglycan and proteoglycan-modifying enzyme gene expression is altered in GBM
The mean expression of a number of proteoglycan core protein genes (A) and proteoglycan-modifying enzymes (B) are altered in GBM relative to non-neoplastic controls. Bars represent the mean log2(Tumor/Normal) ratio +/− SEM gene expression from n=424 primary GBM. TCGA Data Portal [122]; http://cancergenome.nih.gov. Proteoglycan genes include HSPGs (blue); CSPGs (red); and part-time proteoglycans or those commonly modified by KS and DS (white). Enzymes in (B) include those common to both CSPG and HSPG biosynthesis (Com), HSPG biosynthetic enzymes (blue), and CSPG biosynthetic enzymes (red) including those involved in chain elongation and sulfation. The plasma membrane associated and the extracellular enzymes (PM/ECM) include HPSE, extracellular SULFs and HAS family members. For gene names and more information on the proteoglycan core proteins and enzymes, please refer to GeneCards at http://www.genecards.org/. For reviews on proteoglycan synthesis see [176]: HSPG [24]; CSPG [25]; SULF [8]; HPSE [100]; HAS [141]
Figure 3
Figure 3. GBM subtype-specific expression of proteoglycans
Comparison of normalized expression scores (z-scores) for proteoglycan core proteins (A) and the extracellular sulfatases (B) across GBM subtypes. Bars denote mean z-score +/− SEM for tumors in the specified subtype as determined in Verhaak et al. [18] with Classical (black), n=38; Mesenchymal (blue), n=56; Neural (white) n=23; and Proneural (red) n=53; TCGA Data Portal [122]. A negative z-score denotes the expression value was below the GBM population mean. Data were analyzed using 1-way ANOVA; p<0.0001. Tukey’s multiple comparisons test revealed significant differences in gene expression between subtypes; * p< 0.05, ** p<0.01, *** p<0.001, **** P<0.0001.
Figure 4
Figure 4. Alterations in SULF1 and SULF2 expression associated with RTK amplification
SULF1 expression is significantly decreased in EGFR amplified tumors relative to EGFR non-amplified tumors as reflected by the normalized expression scores (z-scores) (A). Linear regression demonstrates a negative correlation between SULF1 and EGFR gene expression across all GBM (B) (n=424, Linear regression slope = −0.3003; Pearson correlation coefficient r = −0.3554; p<0.0001). In contrast, SULF2 expression is significantly upregulated in GBM with PDGFRA amplification relative to non-amplified tumors, as reflected by the normalized expression scores (z-scores) (C). SULF2 gene expression is significantly positively correlated with PDGFRα expression (D); (n=424, Linear regression slope = 0.1222; Pearson correlation coefficient r = 0.2115; p<0.0001). All data are from TCGA Data Portal [122]. (A, C) Bars denote mean z-score +/− SEM for tumors with RTK amplification defined as Log2(Tumor/Normal) >1; EGFR amplified tumors (grey) n=167; EGFR non-amplified tumors (white) n=205; PDGFRA amplified tumors (grey) n=40; PDGFRA non-amplified tumors (white) n=332. Data was analyzed using unpaired Students t-test if the D’Agostino & Pearson omnibus normality test was passed, or the Mann-Whitney U test, if not. * p< 0.05, ** p<0.01, *** p<0.001, **** P<0.0001.
Figure 5
Figure 5. Alterations in proteoglycan core protein expression associated with RTK amplification
CSPG4 expression is significantly increased in both EGFR and PDGFRA amplified tumors relative to non-amplified tumors, as reflected by the normalized expression scores (z-scores) (A, B, left). In contrast, ACAN expression is significantly decreased in EGFR amplified tumors and increased in PDGFRA amplified tumors relative to non-amplified tumors (A, B, right). Bars denote mean z-score +/− SEM from TCGA Data Portal [122]; amplification defined as Log2(tumor/normal) >1; EGFR amplified tumors (grey) n=167; EGFR non-amplified tumors (white) n=205; PDGFRA amplified tumors (grey) n=40; PDGFRA non-amplified tumors (white) n=332. Data was analyzed using unpaired Students t-test if the D’Agostino & Pearson omnibus normality test was passed, or the Mann-Whitney U test, if not. * p< 0.05, ** p<0.01, *** p<0.001, **** P<0.0001.
Figure 6
Figure 6. Tumor heterogeneity in human GBM and human GBM xenografts
Two human GBM xenografts (GBMx14 and GBMx34) display divergent expression of SDC1, HSPG2, and SULF2 by quantitative RT-PCR (A). Immunohistochemistry (B) demonstrates differential expression of SULF2 protein in human GBM (hGBM), human GBM xenografts (GBMx), and in murine NSC-derived models for GBM (mGBM). High SULF2 expression (left) and low/no detectable expression (right). For qRT-PCR, primers: SDC1 (ID 55749479b1); HSPG2 (ID 140972288b2); SULF2 (ID 240255477b1). Immunohistochemistry performed as described previously [11].

References

    1. Louis DN, Ohgaki H, Wiestler OD, Cavenee WK, Burger PC, Jouvet A, Scheithauer BW, Kleihues P. The 2007 WHO classification of tumours of the central nervous system. Acta Neuropathol. 2007;114:97–109. - PMC - PubMed
    1. Fan QW, Cheng C, Hackett C, Feldman M, Houseman BT, Nicolaides T, Haas-Kogan D, James CD, Oakes SA, Debnath J, Shokat KM, Weiss WA. Akt and autophagy cooperate to promote survival of drug-resistant glioma. Sci Signal. 2010;3:ra81. - PMC - PubMed
    1. Stommel JM, Kimmelman AC, Ying H, Nabioullin R, Ponugoti AH, Wiedemeyer R, Stegh AH, Bradner JE, Ligon KL, Brennan C, Chin L, DePinho RA. Coactivation of receptor tyrosine kinases affects the response of tumor cells to targeted therapies. Science. 2007;318:287–90. - PubMed
    1. Snuderl M, Fazlollahi L, Le LP, Nitta M, Zhelyazkova BH, Davidson CJ, Akhavanfard S, Cahill DP, Aldape KD, Betensky RA, Louis DN, Iafrate AJ. Mosaic amplification of multiple receptor tyrosine kinase genes in glioblastoma. Cancer Cell. 2011;20:810–7. - PubMed
    1. Szerlip NJ, Pedraza A, Chakravarty D, Azim M, McGuire J, Fang Y, Ozawa T, Holland EC, Huse JT, Jhanwar S, Leversha MA, Mikkelsen T, Brennan CW. Intratumoral heterogeneity of receptor tyrosine kinases EGFR and PDGFRA amplification in glioblastoma defines subpopulations with distinct growth factor response. Proc Natl Acad Sci U S A. 2012;109:3041–6. - PMC - PubMed

Publication types

MeSH terms