. 2012;6 Suppl 2(Suppl 2):S7.
doi: 10.1186/1752-0509-6-S2-S7. Epub 2012 Dec 12.

PCDq: human protein complex database with quality index which summarizes different levels of evidences of protein complexes predicted from h-invitational protein-protein interactions integrative dataset

Affiliations

PCDq: human protein complex database with quality index which summarizes different levels of evidences of protein complexes predicted from h-invitational protein-protein interactions integrative dataset

Shingo Kikugawa et al. BMC Syst Biol. 2012.

Abstract

Background: Proteins interact with other proteins or biomolecules in complexes to perform cellular functions. Existing protein-protein interaction (PPI) databases and protein complex databases for human proteins are not organized to provide protein complex information or facilitate the discovery of novel subunits. Data integration of PPIs focused specifically on protein complexes, subunits, and their functions. Predicted candidate complexes or subunits are also important for experimental biologists.

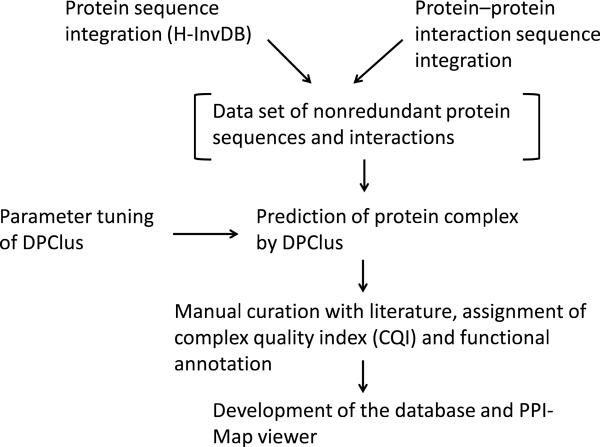
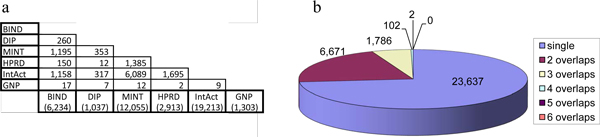
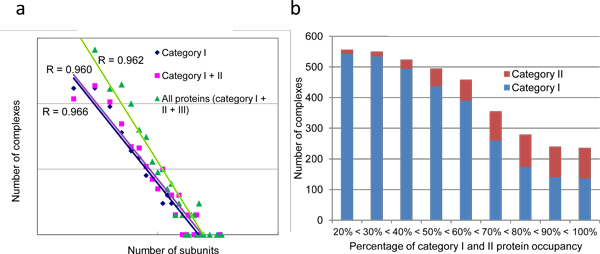
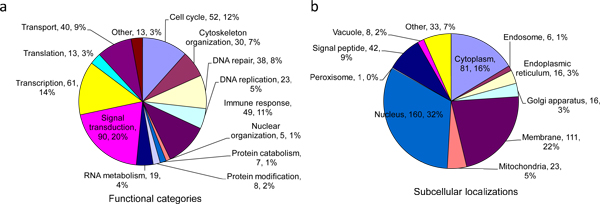
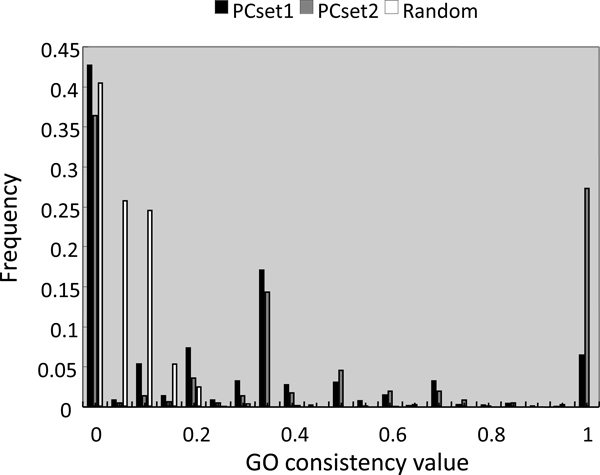
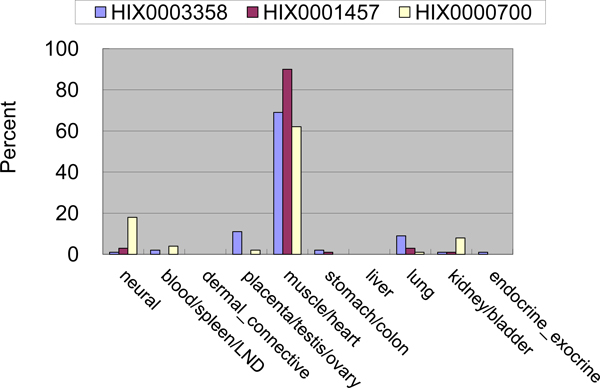
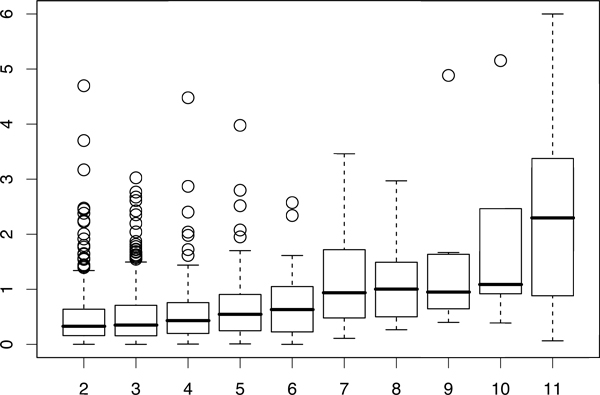
Description: Based on integrated PPI data and literature, we have developed a human protein complex database with a complex quality index (PCDq), which includes both known and predicted complexes and subunits. We integrated six PPI data (BIND, DIP, MINT, HPRD, IntAct, and GNP_Y2H), and predicted human protein complexes by finding densely connected regions in the PPI networks. They were curated with the literature so that missing proteins were complemented and some complexes were merged, resulting in 1,264 complexes comprising 9,268 proteins with 32,198 PPIs. The evidence level of each subunit was assigned as a categorical variable. This indicated whether it was a known subunit, and a specific function was inferable from sequence or network analysis. To summarize the categories of all the subunits in a complex, we devised a complex quality index (CQI) and assigned it to each complex. We examined the proportion of consistency of Gene Ontology (GO) terms among protein subunits of a complex. Next, we compared the expression profiles of the corresponding genes and found that many proteins in larger complexes tend to be expressed cooperatively at the transcript level. The proportion of duplicated genes in a complex was evaluated. Finally, we identified 78 hypothetical proteins that were annotated as subunits of 82 complexes, which included known complexes. Of these hypothetical proteins, after our prediction had been made, four were reported to be actual subunits of the assigned protein complexes.

Conclusions: We constructed a new protein complex database PCDq including both predicted and curated human protein complexes. CQI is a useful source of experimentally confirmed information about protein complexes and subunits. The predicted protein complexes can provide functional clues about hypothetical proteins. PCDq is freely available at http://h-invitational.jp/hinv/pcdq/.


Figures

Figure 1
Figure 1
A flowchart of the database construction process.
Figure 2
Figure 2
Overlap of human PPIs in six PPI databases. (a) Pairwise overlaps of PPIs across databases are shown in cells. The number of nonredundant PPIs is shown in parentheses for each database. (b) Overlaps of PPIs shared in common in one, two, three, four, five, and six databases are shown.
Figure 3
Figure 3
A view of CCIs with the subcellar localizations of the annotated complexes. Each node represents a complex and edges represent interactions. Node size represents the number of proteins in a complex and the thickness of edges connecting complexes, which are exponential to the number of PPIs between connected nodes. Node colors indicate subcellular localization of the annotated complexes; dark red: nucleus, blue: cytoplasm, green: membrane, purple: nucleus and cytoplasm, yellow: Golgi apparatus, blue-green: cytoplasm and membrane, light blue: cytoplasm, membrane and nucleus, orange: mitochondria, light red: endoplasmic reticulum, light green: endosome, gray: other subcellular localization, black: NA/unknown.
Figure 4
Figure 4
Relationship between complexes and subunits. (a) The relationship between complex size (number of different protein subunits of each category; X-axis) and frequency (Y-axis). (b) Percentage of category I and II protein occupancy of the annotated complexes.
Figure 5
Figure 5
Protein complex profiles. (a) Distributions of functional categories of the annotated complexes. (b) Distribution of subcellular localizations of the annotated complexes.
Figure 6
Figure 6
Distributions of GO consistency index in PCset1, PCset2, and random set. Histogram of GO consistency index for protein complexes in PCset1, PCset2, and random set shows a shift toward larger values in the PCset1 and PCset2 than in the random set.
Figure 7
Figure 7
Relative percentage of gene expression levels of the troponin complex. The three gene loci of the troponin complex (complex 258) subunit proteins are expressed specifically in muscle/heart tissue.
Figure 8
Figure 8
Box plot of gene expression profile similarity and the number of protein subunits in a complex. The y-axis indicates gene expression similarity (negative logarithm of p-value of average cosine of gene expression profiles) in a complex; a higher value means that the subunits of the complex show greater similarity in their gene expression profiles. The x-axis indicates the number of protein subunits with expression data in the complex. The gene expression profiles similarity increases with the number of proteins.

References

    1. Hishigaki H, Nakai K, Ono T, Tanigami A, Takagi T. Assessment of prediction accuracy of protein function from protein--protein interaction data. Yeast. 2001;18:523–531. doi: 10.1002/yea.706. - DOI - PubMed
    1. Kemmeren P, van Berkum NL, Vilo J, Bijma T, Donders R, Brazma A, Holstege FC. Protein interaction verification and functional annotation by integrated analysis of genome-scale data. Mol Cell. 2002;9:1133–1143. doi: 10.1016/S1097-2765(02)00531-2. - DOI - PubMed
    1. Titz B, Schlesner M, Uetz P. What do we learn from high-throughput protein interaction data? Expert Rev Proteomics. 2004;1:111–121. doi: 10.1586/14789450.1.1.111. - DOI - PubMed
    1. Bader GD, Hogue CW. BIND--a data specification for storing and describing biomolecular interactions, molecular complexes and pathways. Bioinformatics. 2000;16:465–477. doi: 10.1093/bioinformatics/16.5.465. - DOI - PubMed
    1. Bader GD, Betel D, Hogue CW. BIND: the Biomolecular Interaction Network Database. Nucleic Acids Res. 2003;31:248–250. doi: 10.1093/nar/gkg056. - DOI - PMC - PubMed

Publication types

LinkOut - more resources