

Literature aided determination of data quality and statistical significance threshold for gene expression studies
- PMID: 23282414
- PMCID: PMC3535704
- DOI: 10.1186/1471-2164-13-S8-S23
Literature aided determination of data quality and statistical significance threshold for gene expression studies
Abstract
Background: Gene expression data are noisy due to technical and biological variability. Consequently, analysis of gene expression data is complex. Different statistical methods produce distinct sets of genes. In addition, selection of expression p-value (EPv) threshold is somewhat arbitrary. In this study, we aimed to develop novel literature based approaches to integrate functional information in analysis of gene expression data.
Methods: Functional relationships between genes were derived by Latent Semantic Indexing (LSI) of Medline abstracts and used to calculate the function cohesion of gene sets. In this study, literature cohesion was applied in two ways. First, Literature-Based Functional Significance (LBFS) method was developed to calculate a p-value for the cohesion of differentially expressed genes (DEGs) in order to objectively evaluate the overall biological significance of the gene expression experiments. Second, Literature Aided Statistical Significance Threshold (LASST) was developed to determine the appropriate expression p-value threshold for a given experiment.
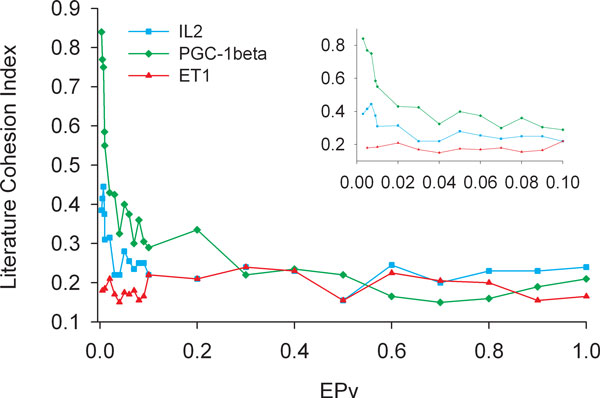
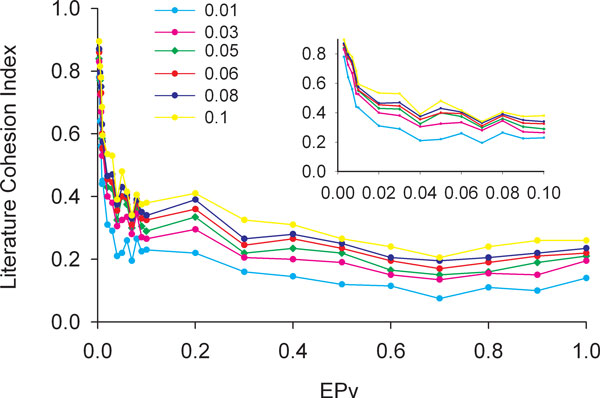
Results: We tested our methods on three different publicly available datasets. LBFS analysis demonstrated that only two experiments were significantly cohesive. For each experiment, we also compared the LBFS values of DEGs generated by four different statistical methods. We found that some statistical tests produced more functionally cohesive gene sets than others. However, no statistical test was consistently better for all experiments. This reemphasizes that a statistical test must be carefully selected for each expression study. Moreover, LASST analysis demonstrated that the expression p-value thresholds for some experiments were considerably lower (p < 0.02 and 0.01), suggesting that the arbitrary p-values and false discovery rate thresholds that are commonly used in expression studies may not be biologically sound.
Conclusions: We have developed robust and objective literature-based methods to evaluate the biological support for gene expression experiments and to determine the appropriate statistical significance threshold. These methods will assist investigators to more efficiently extract biologically meaningful insights from high throughput gene expression experiments.
Figures

Similar articles
-
Evaluation of Sirtuin-3 probe quality and co-expressed genes using literature cohesion.BMC Bioinformatics. 2019 Mar 14;20(Suppl 2):104. doi: 10.1186/s12859-019-2621-z. BMC Bioinformatics. 2019. PMID: 30871457 Free PMC article.
-
Functional cohesion of gene sets determined by latent semantic indexing of PubMed abstracts.PLoS One. 2011 Apr 14;6(4):e18851. doi: 10.1371/journal.pone.0018851. PLoS One. 2011. PMID: 21533142 Free PMC article.
-
Latent Semantic Indexing of PubMed abstracts for identification of transcription factor candidates from microarray derived gene sets.BMC Bioinformatics. 2011 Oct 18;12 Suppl 10(Suppl 10):S19. doi: 10.1186/1471-2105-12-S10-S19. BMC Bioinformatics. 2011. PMID: 22165960 Free PMC article.
-
Statistical analysis of differential gene expression relative to a fold change threshold on NanoString data of mouse odorant receptor genes.BMC Bioinformatics. 2014 Feb 4;15:39. doi: 10.1186/1471-2105-15-39. BMC Bioinformatics. 2014. PMID: 24495268 Free PMC article.
-
Beyond standard pipeline and p < 0.05 in pathway enrichment analyses.Comput Biol Chem. 2021 Jun;92:107455. doi: 10.1016/j.compbiolchem.2021.107455. Epub 2021 Feb 12. Comput Biol Chem. 2021. PMID: 33774420 Free PMC article. Review.
Cited by
-
Evaluation of Sirtuin-3 probe quality and co-expressed genes using literature cohesion.BMC Bioinformatics. 2019 Mar 14;20(Suppl 2):104. doi: 10.1186/s12859-019-2621-z. BMC Bioinformatics. 2019. PMID: 30871457 Free PMC article.
-
Gene expression profiles associated with cigarette smoking and moist snuff consumption.BMC Genomics. 2017 Feb 14;18(1):156. doi: 10.1186/s12864-017-3565-1. BMC Genomics. 2017. PMID: 28193179 Free PMC article.
-
Genomics in 2012: challenges and opportunities in the next generation sequencing era.BMC Genomics. 2012;13 Suppl 8(Suppl 8):S1. doi: 10.1186/1471-2164-13-S8-S1. Epub 2012 Dec 17. BMC Genomics. 2012. PMID: 23281891 Free PMC article.
-
A novel heat shock protein alpha 8 (Hspa8) molecular network mediating responses to stress- and ethanol-related behaviors.Neurogenetics. 2016 Apr;17(2):91-105. doi: 10.1007/s10048-015-0470-0. Epub 2016 Jan 18. Neurogenetics. 2016. PMID: 26780340
-
Integrative Transcriptome Profiling of Cognitive Aging and Its Preservation through Ser/Thr Protein Phosphatase Regulation.PLoS One. 2015 Jun 23;10(6):e0130891. doi: 10.1371/journal.pone.0130891. eCollection 2015. PLoS One. 2015. PMID: 26102285 Free PMC article.
References
-
- Luo J, Schumacher M, Scherer A, Sanoudou D, Megherbi D, Davison T, Shi T, Tong W, Shi L, Hong H, Zhao C, Elloumi F, Shi W, Thomas R, Lin S, Tillinghast G, Liu G, Zhou Y, Herman D, Li Y, Deng Y, Fang H, Bushel P, Woods M, Zhang J. A comparison of batch effect removal methods for enhancement of prediction performance using MAQC-II microarray gene expression data. Pharmacogenomics J. 2010;10:278–291. doi: 10.1038/tpj.2010.57. - DOI - PMC - PubMed
-
- Scherer A. Batch Effects and Noise in Microarray Experiments: Sources and Solutions. Wiley Series Probability Statistics. 2009.
-
- Shi L, Reid LH, Jones WD, Shippy R, Warrington JA, Baker SC, Collins PJ, de Longueville F, Kawasaki ES, Lee KY, Luo Y, Sun YA, Willey JC, Setterquist RA, Fischer GM, Tong W, Dragan YP, Dix DJ, Frueh FW, Goodsaid FM, Herman D, Jensen RV, Johnson CD, Lobenhofer EK, Puri RK, Schrf U, Thierry-Mieg J, Wang C, Wilson M, Wolber PK. et al.The MicroArray Quality Control (MAQC) project shows inter-and intraplatform reproducibility of gene expression measurements. Nat Biotechnol. 2006;24:1151–1161. doi: 10.1038/nbt1239. - DOI - PMC - PubMed
-
- Shi L, Campbell G, Jones WD, Campagne F, Wen Z, Walker SJ, Su Z, Chu TM, Goodsaid FM, Pusztai L, Shaughnessy JD, Oberthuer A, Thomas RS, Paules RS, Fielden M, Barlogie B, Chen W, Du P, Fischer M, Furlanello C, Gallas BD, Ge X, Megherbi DB, Symmans WF, Wang MD, Zhang J, Bitter H, Brors B, Bushel PR, Bylesjo M. et al.The MicroArray Quality Control (MAQC)-II study of common practices for the development and validation of microarray-based predictive models. Nat Biotechnol. 2010;28:827–838. doi: 10.1038/nbt.1665. - DOI - PMC - PubMed
Publication types
MeSH terms
LinkOut - more resources
Full Text Sources
