

A cell-level biomechanical model of Drosophila dorsal closure
- PMID: 23283225
- PMCID: PMC3514517
- DOI: 10.1016/j.bpj.2012.09.036
A cell-level biomechanical model of Drosophila dorsal closure
Abstract
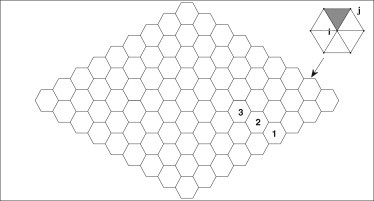
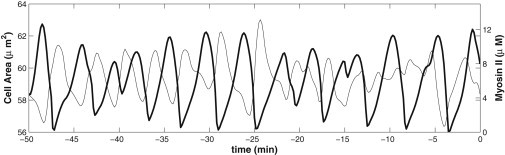
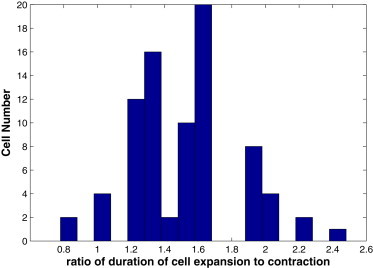
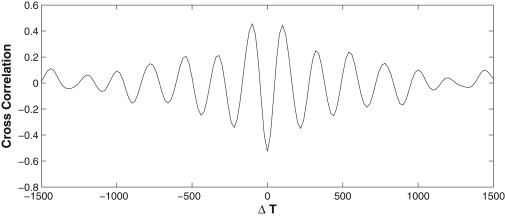
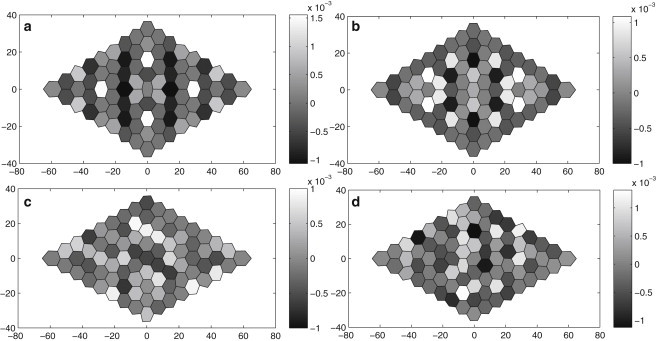
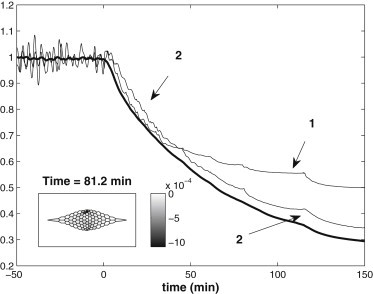
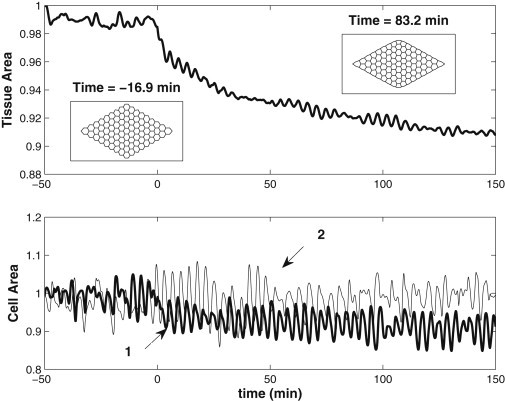
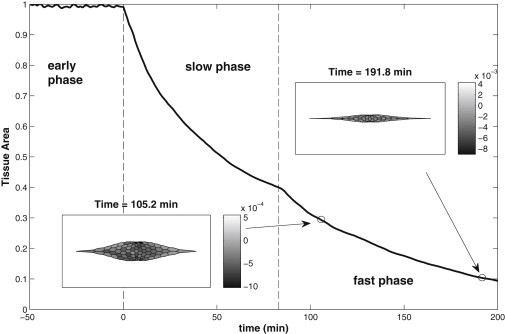
We report a model describing the various stages of dorsal closure of Drosophila. Inspired by experimental observations, we represent the amnioserosa by 81 hexagonal cells that are coupled mechanically through the position of the nodes and the elastic forces on the edges. In addition, each cell has radial spokes representing actin filaments on which myosin motors can attach and exert contractile forces on the nodes, the attachment being controlled by a signaling molecule. Thus, the model couples dissipative cell and tissue motion with kinetic equations describing the myosin and signal dynamics. In the early phase, amnioserosa cells oscillate as a result of coupling among the chemical signaling, myosin attachment/detachment, and mechanical deformation of neighboring cells. In the slow phase, we test two ratcheting mechanisms suggested by experiments: an internal ratchet by the apical and junctional myosin condensates, and an external one by the supracellular actin cables encircling the amnioserosa. Within the range of parameters tested, the model predictions suggest the former as the main contributor to cell and tissue area reduction in this stage. In the fast phase of dorsal closure, cell pulsation is arrested, and the cell and tissue areas contract consistently. This is realized in the model by gradually shrinking the resting length of the spokes. Overall, the model captures the key features of dorsal closure through the three distinct phases, and its predictions are in good agreement with observations.
Copyright © 2012 Biophysical Society. Published by Elsevier Inc. All rights reserved.
Figures
Comment in
-
Mechano-chemical coupling drives cell area oscillations during morphogenesis.Biophys J. 2013 Jan 8;104(1):1-3. doi: 10.1016/j.bpj.2012.11.3822. Epub 2013 Jan 8. Biophys J. 2013. PMID: 23332051 Free PMC article. No abstract available.
Similar articles
-
Membrane waves driven by actin and Myosin.Phys Rev Lett. 2007 Apr 20;98(16):168103. doi: 10.1103/PhysRevLett.98.168103. Epub 2007 Apr 20. Phys Rev Lett. 2007. PMID: 17501468
-
A biomechanical model for cell polarization and intercalation during Drosophila germband extension.Phys Biol. 2015 Sep 10;12(5):056011. doi: 10.1088/1478-3975/12/5/056011. Phys Biol. 2015. PMID: 26356256
-
Nonmuscle myosin II generates forces that transmit tension and drive contraction in multiple tissues during dorsal closure.Curr Biol. 2005 Dec 20;15(24):2208-21. doi: 10.1016/j.cub.2005.11.064. Curr Biol. 2005. PMID: 16360683
-
Mathematical models of dorsal closure.Prog Biophys Mol Biol. 2018 Sep;137:111-131. doi: 10.1016/j.pbiomolbio.2018.05.009. Epub 2018 May 29. Prog Biophys Mol Biol. 2018. PMID: 29852207 Free PMC article. Review.
-
Vesicle transport: the role of actin filaments and myosin motors.Microsc Res Tech. 1999 Oct 15;47(2):93-106. doi: 10.1002/(SICI)1097-0029(19991015)47:2<93::AID-JEMT2>3.0.CO;2-P. Microsc Res Tech. 1999. PMID: 10523788 Review.
Cited by
-
Powering morphogenesis: multiscale challenges at the interface of cell adhesion and the cytoskeleton.Mol Biol Cell. 2022 Jul 1;33(8):pe4. doi: 10.1091/mbc.E21-09-0452. Mol Biol Cell. 2022. PMID: 35696393 Free PMC article. Review.
-
Local, cell-nonautonomous feedback regulation of myosin dynamics patterns transitions in cell behavior: a role for tension and geometry?Mol Biol Cell. 2013 Aug;24(15):2350-61. doi: 10.1091/mbc.E12-12-0868. Epub 2013 Jun 5. Mol Biol Cell. 2013. PMID: 23741052 Free PMC article.
-
Generating active T1 transitions through mechanochemical feedback.Elife. 2023 Apr 11;12:e79862. doi: 10.7554/eLife.79862. Elife. 2023. PMID: 37039463 Free PMC article.
-
Dynamics of PAR Proteins Explain the Oscillation and Ratcheting Mechanisms in Dorsal Closure.Biophys J. 2018 Dec 4;115(11):2230-2241. doi: 10.1016/j.bpj.2018.10.014. Epub 2018 Oct 24. Biophys J. 2018. PMID: 30446158 Free PMC article.
-
Apical oscillations in amnioserosa cells: basolateral coupling and mechanical autonomy.Biophys J. 2013 Jul 2;105(1):255-65. doi: 10.1016/j.bpj.2013.05.027. Biophys J. 2013. PMID: 23823245 Free PMC article.
References
-
- Heisenberg C.-P. Dorsal closure in Drosophila: cells cannot get out of the tight spot. Bioessays. 2009;31:1284–1287. - PubMed
-
- Gorfinkiel N., Schamberg S., Blanchard G.B. Integrative approaches to morphogenesis: lessons from dorsal closure. Genesis. 2011;49:522–533. - PubMed
-
- Solon J., Kaya-Copur A., Brunner D. Pulsed forces timed by a ratchet-like mechanism drive directed tissue movement during dorsal closure. Cell. 2009;137:1331–1342. - PubMed
Publication types
MeSH terms
Substances
LinkOut - more resources
Full Text Sources
Molecular Biology Databases
Miscellaneous
