

No consistent relationship between gamma power and peak frequency in macaque primary visual cortex
- PMID: 23283318
- PMCID: PMC3560843
- DOI: 10.1523/JNEUROSCI.1687-12.2013
No consistent relationship between gamma power and peak frequency in macaque primary visual cortex
Abstract
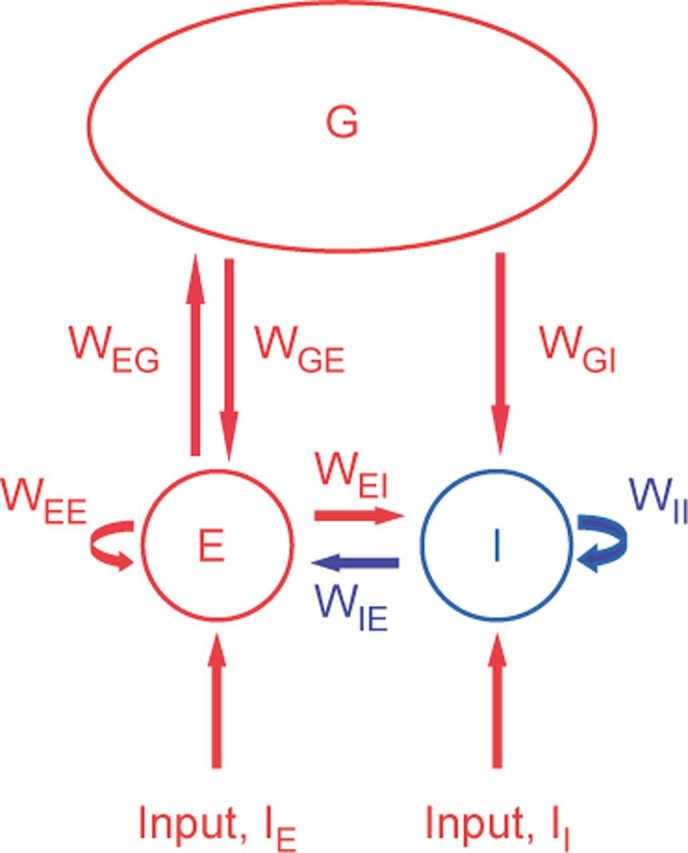
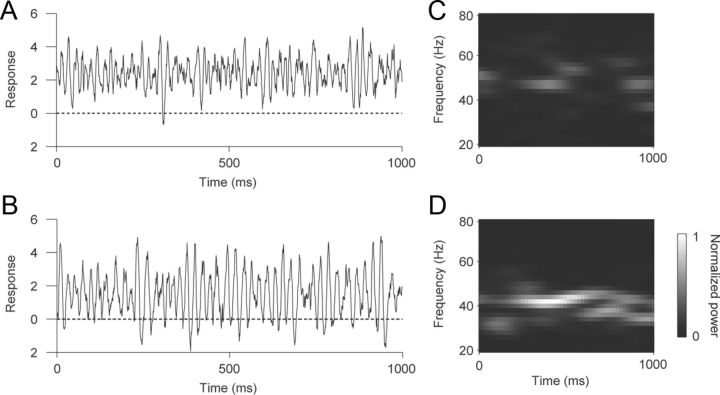
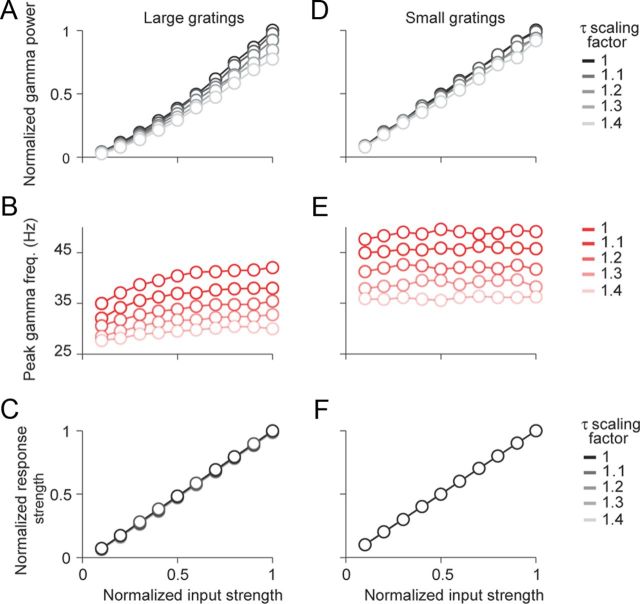
Neural activity in the gamma frequency range ("gamma") is elevated during active cognitive states. Gamma has been proposed to play an important role in cortical function, although this is debated. Understanding what function gamma might fulfill requires a better understanding of its properties and the mechanisms that generate it. Gamma is characterized by its spectral power and peak frequency, and variations in both parameters have been associated with changes in behavioral performance. Modeling studies suggest these properties are co-modulated, but this has not been established. To test the relationship between these properties, we measured local field potentials (LFPs) and neuronal spiking responses in primary visual cortex of anesthetized monkeys, for drifting sinusoidal gratings of different sizes, contrasts, orientations and masked with different levels of noise. We find that there is no fixed relationship between LFP gamma power and peak frequency, and neither is related to the strength of spiking activity. We propose a simple model that can account for the complex stimulus dependence we observe, and suggest that separate mechanisms determine gamma power and peak frequency.
Figures


Similar articles
-
LFP power spectra in V1 cortex: the graded effect of stimulus contrast.J Neurophysiol. 2005 Jul;94(1):479-90. doi: 10.1152/jn.00919.2004. Epub 2005 Feb 9. J Neurophysiol. 2005. PMID: 15703230
-
Cortical dynamics during naturalistic sensory stimulations: experiments and models.J Physiol Paris. 2011 Jan-Jun;105(1-3):2-15. doi: 10.1016/j.jphysparis.2011.07.014. Epub 2011 Aug 31. J Physiol Paris. 2011. PMID: 21907800
-
Comparison of direction and object selectivity of local field potentials and single units in macaque posterior parietal cortex during prehension.J Neurophysiol. 2007 May;97(5):3684-95. doi: 10.1152/jn.00886.2006. Epub 2007 Mar 21. J Neurophysiol. 2007. PMID: 17376847
-
High frequency oscillations as a correlate of visual perception.Int J Psychophysiol. 2011 Jan;79(1):32-8. doi: 10.1016/j.ijpsycho.2010.07.004. Epub 2010 Jul 21. Int J Psychophysiol. 2011. PMID: 20654659 Review.
-
Spike-Gamma Phase Relationship in the Visual Cortex.Annu Rev Vis Sci. 2022 Sep 15;8:361-381. doi: 10.1146/annurev-vision-100419-104530. Epub 2022 Jun 6. Annu Rev Vis Sci. 2022. PMID: 35667158 Review.
Cited by
-
Tuning Neural Synchronization: The Role of Variable Oscillation Frequencies in Neural Circuits.Front Syst Neurosci. 2022 Jul 8;16:908665. doi: 10.3389/fnsys.2022.908665. eCollection 2022. Front Syst Neurosci. 2022. PMID: 35873098 Free PMC article. Review.
-
Decorrelated Input Dissociates Narrow Band γ Power and BOLD in Human Visual Cortex.J Neurosci. 2017 May 31;37(22):5408-5418. doi: 10.1523/JNEUROSCI.3938-16.2017. Epub 2017 Apr 28. J Neurosci. 2017. PMID: 28455370 Free PMC article.
-
Risk of punishment influences discrete and coordinated encoding of reward-guided actions by prefrontal cortex and VTA neurons.Elife. 2017 Oct 23;6:e30056. doi: 10.7554/eLife.30056. Elife. 2017. PMID: 29058673 Free PMC article.
-
Large Visual Stimuli Induce Two Distinct Gamma Oscillations in Primate Visual Cortex.J Neurosci. 2018 Mar 14;38(11):2730-2744. doi: 10.1523/JNEUROSCI.2270-17.2017. Epub 2018 Feb 9. J Neurosci. 2018. PMID: 29440388 Free PMC article.
-
Reconciliation of weak pairwise spike-train correlations and highly coherent local field potentials across space.Cereb Cortex. 2024 Oct 3;34(10):bhae405. doi: 10.1093/cercor/bhae405. Cereb Cortex. 2024. PMID: 39462814 Free PMC article.
References
-
- Albrecht DG, Hamilton DB. Striate cortex of monkey and cat: contrast response function. J Neurophysiol. 1982;48:217–237. - PubMed
-
- Anderson JS, Carandini M, Ferster D. Orientation tuning of input conductance, excitation, and inhibition in cat primary visual cortex. J Neurophysiol. 2000;84:909–926. - PubMed
-
- Angelucci A, Bressloff PC. Contribution of feedforward, lateral and feedback connections to the classical receptive field center and extra-classical receptive field surround of primate V1 neurons. Prog Brain Res. 2006;154:93–120. - PubMed
-
- Bartolo MJ, Gieselmann MA, Vuksanovic V, Hunter D, Sun L, Chen X, Delicato LS, Thiele A. Stimulus-induced dissociation of neuronal firing rates and local field potential gamma power and its relationship to the resonance blood oxygen level-dependent signal in macaque primary visual cortex. Eur J Neurosci. 2011;34:1857–1870. - PMC - PubMed
Publication types
MeSH terms
Grants and funding
LinkOut - more resources
Full Text Sources
Other Literature Sources