. 2013 Jan 2;33(1):35-51.
doi: 10.1523/JNEUROSCI.0245-12.2013.

Transsynaptic tracing with vesicular stomatitis virus reveals novel retinal circuitry

Affiliations

Transsynaptic tracing with vesicular stomatitis virus reveals novel retinal circuitry

Kevin T Beier et al. J Neurosci. .

Abstract

The use of neurotropic viruses as transsynaptic tracers was first described in the 1960s, but only recently have such viruses gained popularity as a method for labeling neural circuits. The development of retrograde monosynaptic tracing vectors has enabled visualization of the presynaptic sources onto defined sets of postsynaptic neurons. Here, we describe the first application of a novel viral tracer, based on vesicular stomatitis virus (VSV), which directs retrograde transsynaptic viral spread between defined cell types. We use this virus in the mouse retina to show connectivity between starburst amacrine cells (SACs) and their known synaptic partners, direction-selective retinal ganglion cells, as well as to discover previously unknown connectivity between SACs and other retinal ganglion cell types. These novel connections were confirmed using physiological recordings. VSV transsynaptic tracing enables cell type-specific dissection of neural circuitry and can reveal synaptic relationships among neurons that are otherwise obscured due to the complexity and density of neuropil.


Figures

Figure 1.
Figure 1.
Schematics of viral tracing systems. A, Monosynaptic retrograde RABV tracing system, as developed by Wickersham et al. (2007). i, First, the TVA receptor, RABV G, and DsRed are transfected into a population of “starter cells” (red). ii, Then, the transfected region is infected with a GFP-expressing RABV pseudotyped with A/RG. (iii) Infected starter cells would therefore become yellow. iii, iv, The GFP-RABV then spreads from the starter cells (yellow) to nearby, retrogradely connected neurons (green) (iv). B, The VSV pseudotyping strategy used throughout this study. i, The recombinant VSV vectors have six genes, including GFP, and the VSV genes, N, P, M, G, and L. The VSV G gene was replaced with the gene encoding the A/RG chimeric glycoprotein (Wickersham et al., 2007). ii, To pseudotype rVSV(A/RG) with RABV G, tissue culture cells were first transfected with a plasmid encoding RABV G. iii, Once expressing RABV G, the cells were infected with the rVSV(A/RG) virus. iv, v, The infected cells produce both the RABV G (green) and A/RG (orange) glycoproteins (iv), resulting in virions containing both glycoproteins in the viral envelope (v). C, The retrograde tracing method conducted in this study to analyze microcircuitry. i, The presence of the RABV G-protein in the virion envelope permits retrograde transport. ii, RGCs projecting to the LGN would thus be labeled by an injection into the LGN (green). Once the virus enters a cell that has retrogradely taken up the virion, replication occurs, and virions are released. These virions can only infect TVA-expressing neurons (red), as the rVSV genome encodes only A/RG. These TVA-expressing cells are red as they have recombined a tdTomato reporter by Cre. The RABV G C-terminal domain present in the A/RG chimeric glycoprotein directs infectious particle release to the cell body and dendrites, causing the virus to transmit specifically to presynaptic neurons expressing TVA. iii, Cells infected by retrograde transmission following rVSV with A/RG production by RGCs will be yellow, as they will express GFP from viral infection as well as tdTomato. Cells that were infected by retrograde transport from the initial inoculum will only be green from GFP.
Figure 2.
Figure 2.
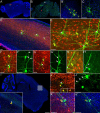
rVSV(A/RG) labels local microcircuitry in a retrograde direction in restricted recipient neuron populations. A, When rVSV(A/RG) was injected into the motor cortex of a mouse constitutively expressing TVA, by 3 dpi, local infection was observed at the injection site (red arrowhead), but no evidence of long-distance retrograde or anterograde transport was observed. B, To test for neuron-to-neuron transmission properties, RABV G was used to pseudotype rVSV(A/RG) (as shown in Fig. 1B) to permit retrograde infection away from the injection site. In this case, the CP was injected (red arrowhead), permitting infection of ipsilateral L3 and L5 cortical pyramidal neurons (white arrowhead) and local spread from these cortical neurons. B′, A higher magnification of the area marked by a white arrowhead in B, with the white arrowhead showing a pyramidal neuron labeled by initial infection. The neurons likely infected by virus spread (yellow arrowheads) were near the dendrites of the pyramidal cell, consistent with retrograde viral transmission. C, No spread from projection neurons, here a L2/3 cortical pyramidal neuron, that were infected by the initial inoculum [rVSV(A/RG) pseudotyped with RABV G] was observed in animals not expressing TVA. D–H, rVSV(A/RG) pseudotyped with RABV G was injected into the CP of mice expressing TVA and tdTomato specifically in PV-Cre-expressing cells. At 3 dpi, L3 and L5 projection neurons ipsilaterally were infected by the initial inoculum. These neurons then produced rVSV(A/RG), which infected synaptically connected TVA-expressing upstream cells. D, Initially infected ipsilateral L3 pyramidal neurons (white arrowheads), with a single yellow local interneuron (yellow arrowhead). All cells that were not L3 or L5 projection neurons expressed tdTomato. E, High magnification of an infected region of the cortex, showing three local TVA-expressing interneurons (yellow arrowheads). These were infected by viral spread from initially infected pyramidal neurons (white arrowheads). F–H, Pairs of pyramidal and local interneurons, with the pyramidal neuron indicated by the white arrowheads, and interneuron by the yellow arrowheads. All yellow neurons were basket cells, which express PV. The single-neuron resolution permits visualization of the physical overlap between neurons (white arrows in F′, G′, H′ show examples of such overlaps). I, J, The viral titer can be adjusted to give single neuron resolution. When virus was injected into the CP of a VGlut3-Cre/cTVA/cR26TdT mouse, only two labeled neurons were observed in this 100 μm parasaggital section—a pyramidal neuron (white arrowhead), and a local TVA-expressing neuron to which the virus spread (yellow arrowhead) (I, inset). J, Higher magnification of the cells in I (insets indicate that the cell to which the yellow arrowhead points is tdTomato+), and J′ indicates overlap of neuronal processes. K, Adenovirus-Cre was injected into the motor cortex of a cTVA/cR26TdT mouse. rVSV(A/RG) pseudotyped with RABV G was injected into the same coordinates in the opposite hemisphere from the Adenovirus-Cre. At 3 dpi, projection neurons were initially infected by rVSV through retrograde uptake of virus. Interneurons that were infected with Adenovirus-Cre (tdTomato-positive cells) were occasionally infected (yellow cell, yellow arrowhead) by spread of rVSV(A/RG) from the projection neuron (green cell, white arrowhead). Green, viral fluorescence; red, tdTomato-based Cre reporter; blue, DAPI. Scale bars: B′–H, J, K, 50 μm; A, B, I, 1 mm.
Figure 3.
Figure 3.
Most of the major classes of RGCs could be observed from LGN injection of rVSV(A/RG) pseudotyped with RABV G. Among the RGCs labeled, using the classification of murine RGCs reported previously (Völgyi et al., 2009), were small dendritic arbor RGCs (A, B), G7 RGCs (Völgyi et al., 2009), which are similar to outer δ-cells in the rat retina (C), Cdh3-RGCs (Osterhout et al., 2011) (D), ON-OFF-DSGCs, which respond in a directionally specific manner and stratify in both the ON and OFF ChAT laminae (E), ON-DS GCs, which respond in a directionally specific manner and stratify in only the ON ChAT lamina (F), OFF-α, OFF-brisk transient RGCs (G), ON-α, ON-brisk transient RGCs (H), and OFF-DSGCs, which respond in a directionally specific manner and stratify above the OFF-ChAT lamina (I). Images were taken 2 dpi. Scale bars, 20 μm.
Figure 4.
Figure 4.
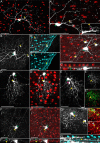
Injection of rVSV(A/RG) pseudotyped with RABV G into the LGN leads to infection of RGCs and transmission specifically to TVA-expressing SACs. A, RGCs were labeled by a viral injection into the LGN (arrows indicate examples of RGCs). Injection labeled a wide variety of RGCs projecting into the LGN, including those that were morphologically consistent with ON-OFF-DSGCs (B), OFF-α (C), and asymmetric nasal-directed J-RGCs (D) (among others, Fig. 4). B′, C′, and D′ show side views of the cells in B–D, indicating the IPL lamination patterns of these RGCs. Chat laminae are indicated by the numbers 2 and 4, based on labeling of laminae 2 and 4 with an anti-ChAT antibody, shown in cyan. E, F, Examples of infected OFF-DSGCs (green), which stratified between the TH (white, lamina 1) and ChAT (red, lamina 2) laminae. Images are z-stack reconstructions of confocal images. G, A cross section showing an example of an infected ON-OFF-DSGC, stratifying exclusively in ChAT laminae 2 and 4 (blue stripes). H, H′, The expression pattern of recombined tdTomato that resulted from a cross of a conditional tdTomato allele to a ChAT-Cre mouse (red). Green shows ChAT antibody staining. While all ON-SACs were both red and green, some OFF-SACs were red (Cre-expression history), but not green (ChAT antibody), or green and not red. I, A pair of GFP-labeled cells are shown (white), an asymmetric ON-OFF-DSGC (green arrowhead) and an OFF-SAC (yellow arrowhead). I and I′ highlight the RGC dendritic processes, while I″ and I‴ indicate that the putative SAC indeed stains with an anti-ChAT antibody (cyan). J, An ON-OFF-DSGC (green arrowhead) transmitted rVSV(A/RG) to both ON and OFF-SACs (yellow arrowheads). J′, Note how this DSGC was bistratified in the ON and OFF ChAT laminae and that the SAC somas were predominately located within ∼180° of the dendritic field of the RGC. The image shown in J corresponds to Fig. 6F. All images of viral infection were taken 2 dpi. Scale bars: E, F, 15 μm; rest, 50 μm. Images: A–F, I, 2 dpi; G, J, 4 dpi.
Figure 5.
Figure 5.
Quantification of SAC labeling from LGN injection of rVSV(A/RG) pseudotyped with RABV G. A, The percentages of RGC types labeled from initial LGN infection (N = 288 RGCs) at 2 dpi, assessed by morphology (for examples, see Figs. 3 and 4). Sixty-nine of those RGCs contributed to the N = 348 assessed for spread from 2 to 7 dpi (C, D). B, ON-OFF and ON-DSGCs were the most efficient at labeling SACs (61 of 127), and while the efficiency of OFF-DSGCs (8 of 19) and OFF (6 of 19) and ON-α (2 of 11) RGCs was less, they were more efficient than small-arbor RGCs (0%). Other RGCs that transmitted virus to SACs included two wide-field transient ON-RGCs that stratified between the ChAT bands and transmitted to ON-SACs, and one wide-field OFF-RGC, morphologically similar to a W7 RGC (Kim et al., 2010), a sustained OFF-RGC that stratified above and below the OFF-ChAT band, that transmitted virus to an ON-SAC. All counts from morphologically identified RGCs were obtained 2 dpi. C, D, The number of RGCs (N = 348) that transmitted virus to SACs increased over time, up to 59% at 5 dpi (C), while the number of SACs labeled per RGC remained constant (D). E, Summary of numbers of RGCs and SACs analyzed in this paper. F, Breakdown of transmission efficiency to SACs per RGC subtype, and SAC distributions around RGC types, if applicable.
Figure 6.
Figure 6.
Labeled SACs (blue arrows) from ON-OFF-DSGCs (red arrow) are preferentially located in one-half of the DSGC receptive field. A–F, Polar plots indicate the angle from the ON-OFF-DSGC soma to the SAC soma, and number of SACs at those locations. In each case, an angle of optimal separation (dashed blue line) was chosen that maximized the number of SACs on one side (180°; max side) and minimized the number of SACs on the other side (min side). In some cases, the angle of optimal separation was not unique (e.g., two angles could yield the same maximal 5:2 ratio in F). All images were taken 4 dpi. Scale bars, 50 μm. G, For each DSGC (n = 15), the labeled SACs were reassigned random angles in a simulation, given the null hypothesis (no asymmetry in SAC location), and an angle of optimal separation was determined as with the real data. H, A simulation of 15 DSGCs shows the number of SACs on the max versus min sides for each model DSGC (red points; overlapping points have been displaced slightly for visualization). I, Same format as H for the 15 DSGCs in the real dataset. J, Running the simulation 1,000,000 times yielded a distribution of total SACs on the max sides (of 84 SACs total) for each group of 15 simulated DSGCs. The probability of obtaining the actual value (75 SACs on the max sides) by chance was p < 0.01.
Figure 7.
Figure 7.
rVSV(A/RG) provides evidence for novel direct synaptic connectivity of SACs. A, A′, An ON-DSGC (green arrowhead), which sent vertical processes to the OFF-ChAT lamina, transmitted virus to an OFF-SAC (yellow arrowhead). These cells did not costratify, as the ON-DSGC stratified exclusively in lamina 4, and the OFF-SAC stratified in lamina 2. A′, A higher magnification of A, and the inset shows the vertical processes from the ON-DSGC (magenta arrow), while the yellow arrowhead indicates the SAC. White, Viral fluorescence; red, Cre reporter. B, C, OFF-α- and ON-α-RGCs showed connectivity to OFF-SACs or ON-SACs, respectively. B shows the morphology of an OFF-α-RGC (green arrowhead) and OFF-SACs (yellow arrowheads), and B′ and B″ show a higher magnification of the two non-RGCs, indicating that the cells (white) were indeed SACs, as evidenced by overlap with an anti-ChAT antibody (cyan). Only OFF-SACs were labeled from this RGC type. C–C‴, An example of an ON-α-RGC (green arrowhead) labeling ON-SACs (yellow arrowheads). C′ is a cross section through the image shown in C to indicate dendritic lamination location. White, Viral fluorescence; red, Cre reporter. D–G, Viral transmission to SACs occurred from asymmetric and symmetric OFF-DSGCs. D, D′, A maximum-intensity projection, indicating an asymmetric OFF-DSGC (green arrowhead) and an OFF-SAC (yellow arrowhead). White, Viral fluorescence; red, Cre-mediated tdTomato expression. E, A maximum-intensity projection of an OFF-DSGC (green arrowhead), with two labeled SACs (yellow and magenta arrowheads). While the ON-SAC in E is easily observed (magenta arrowhead), the OFF-SAC in E′ (yellow arrowhead) is obscured by the OFF-DSGC dendrites in the maximum-intensity projections. E″, This cell also stains positive for the anti-ChAT antibody. Green, viral fluorescence; red, Cre-mediated tdTomato expression. F–F‴, A symmetric OFF-DSGC (green arrowhead) transmitted virus to an ON-SAC (yellow arrowhead). The stratification of the OFF-DSGC (F′, F‴) is above the OFF-ChAT lamina 2, while that of the SAC is in the ON-ChAT lamina. White, Viral fluorescence; red, Cre-mediated tdTomato expression. G–G‴, A symmetric OFF-DSGC (green arrowhead) and two nearby ON-SACs (yellow arrowheads). G shows a Z-section through lamina 4. G′ is an optical section of the same cells, which indicates that the stratification of the OFF-DSGC was above lamina 2 (green arrowhead), and the ON-SAC stratification was in lamina 4 (yellow arrowhead). The processes of these neurons overlapped, even though they did not costratify. White, viral fluorescence; cyan, anti-ChAT antibody. G″ and G‴ indicate that the RGC (white arrowhead with green fill) did not express ChAT, while the SACs (yellow arrowheads) did express ChAT, as indicated by colabel of viral GFP and tdTomato (insets). Images: B–E, taken 2 dpi; F, taken 3 dpi; A, G, taken 4 dpi. Scale bars, 50 μm.
Figure 8.
Figure 8.
Dendritic stratification of genetically identified RGC subtypes relative to SAC-cholinergic lamina in the IPL. A, E, I, Alexa 555 fills of individual GFP+ RGCs (targeted on the basis of GFP fluorescence). The location of the dendritic arbors (shown in green) from ON-OFF-DSGCs (B, C), OFF-α-RGCs (F, G), and bistratified NIF RGCs (J, K) relative to labeled SAC processes (magenta) are shown, with overlap appearing as light blue/white. D, H, L, Summary schematics of the RGC dendritic arborization patterns relative to the VAChT labeling (SAC arbors) for each RGC subtype. Scale bar: A, E, I, 50 μm; B, F, J, 15 μm; C, G, K, 10 μm.
Figure 9.
Figure 9.
Functional cholinergic connections between SACs and identified RGC types. A, Two-photon fluorescence images of SAC dendrites (green) and ON-α-RGC dendrites (red). B, Whole-cell patch recording of a ChR2-expressing SAC from a ChAT-Cre/ChR2 retina. The top trace shows the response to a 100% contrast modulation of a spot (400 μm diameter) on a photopic background (∼104 R* · cone−1 · s−1). The middle and bottom traces show the response to ChR2 activation in the presence of synaptic blockers (DNQX, d-AP5, l-AP4, strychnine), before and after adding gabazine. C, Whole-cell patch recording from an ON-α-RGC in a ChAT-Cre/ChR2 retina in the presence of synaptic blockers (DNQX, d-AP5, l-AP4, strychnine, gabazine). Four pulses of a ChR2-activating stimulus evoked fast tubocurarine-sensitive excitatory currents and a slow, intrinsic melanopsin-mediated inward current. The melanopsin response evoked on the first trial recovered with a time constant >30 s and persisted throughout the second trial (intertrial interval, 2.5 s). D, Tubocurarine-sensitive excitatory currents evoked by ChR2 activation, recorded in the presence of synaptic blockers (DNQX, d-AP5, l-AP4, strychnine, gabazine). Responses (average of >10 ChR2 activations) were observed in ON-α cells (9 of 9), OFF-α-RGCs (4 of 4), and OFF-δ-RGCs (7 of 8). E, Pharmacological block with AChR antagonists tubocurarine (50 μm) and hexamethonium (100 μm) strongly suppressed the excitatory input evoked by ChR2 activation in the presence of synaptic blockers. F, Current–voltage relationship of the RGC response evoked by ChR2 activation in the ChAT-Cre/ChR2 retina (average of 4 ON-α and 1 OFF-δ cell). AChR-mediated responses were recorded in the presence of synaptic blockers (described in D) and normalized to the response at the most negative holding potential. Error bars indicate SEM across cells. Scale bar, 10 μm.
Figure 10.
Figure 10.
Summary of experimental results observed in this study. The left column indicates a cross section of the retina, whereas the middle column indicates a view of an intact retina within the planes of the inner nuclear and RGC layers. The right column indicates whether or not the indicated pattern was observed in this study. A, The expected transsynaptic viral transmission pattern of ON-OFF-DSGCs to SACs. Both ON- and OFF-SACs would be expected to be labeled, as was observed. B, Nonsynaptic viral transmission from ON-OFF-DSGCs would be expected to label SACs with dendritic arbors not overlapping that of the DSGC, which was not observed. In addition, SAC-to-SAC transmission might have created this pattern, but again, this was not seen. C–F, Viral transmission from other RGC classes. C, ON-DSGCs, which are known to receive synaptic input from ON-SACs, transmitted to ON-SACs. Transmission was also seen to OFF-SACs by ON-DSGCs. D, E, OFF-α-RGCs transmitted virus to OFF-SACs (D), while ON-α-RGCs transmitted virus to ON-SACs (E). F, OFF-DSGCs, both asymmetric and symmetric, also transmitted virus to both ON and OFF-SACs.

References

    1. Barlow HB, Hill RM. Selective sensitivity to direction of movement in ganglion cells of the rabbit retina. Science. 1963;139:412–414. - PubMed
    1. Beier KT, Samson ME, Matsuda T, Cepko CL. Conditional expression of the TVA receptor allows clonal analysis of descendents from Cre-expressing progenitor cells. Dev Biol. 2011a;353:309–320. - PMC - PubMed
    1. Beier KT, Saunders A, Oldenburg IA, Miyamichi K, Akhtar N, Luo L, Whelan SP, Sabatini B, Cepko CL. Anterograde or retrograde transsynaptic labeling of CNS neurons with vesicular stomatitis virus vectors. Proc Natl Acad Sci U S A. 2011b;108:15414–15419. - PMC - PubMed
    1. Borghuis BG, Tian L, Xu Y, Nikonov SS, Vardi N, Zemelman BV, Looger LL. Imaging light responses of targeted neuron populations in the rodent retina. J Neurosci. 2011;31:2855–2867. - PMC - PubMed
    1. Briggman KL, Helmstaedter M, Denk W. Wiring specificity in the direction-selectivity circuit of the retina. Nature. 2011;471:183–188. - PubMed

Publication types

Substances