. 2013 Jan 2;33(1):52-63.
doi: 10.1523/JNEUROSCI.2422-12.2013.

Signals for previous goal choice persist in the dorsomedial, but not dorsolateral striatum of rats

Affiliations

Signals for previous goal choice persist in the dorsomedial, but not dorsolateral striatum of rats

Hoseok Kim et al. J Neurosci. .

Abstract

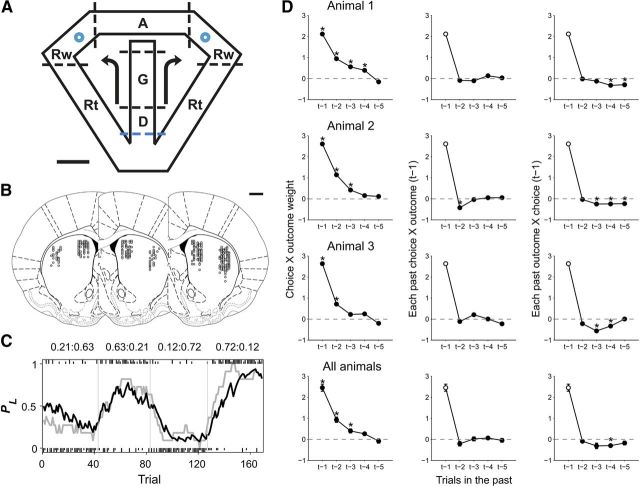
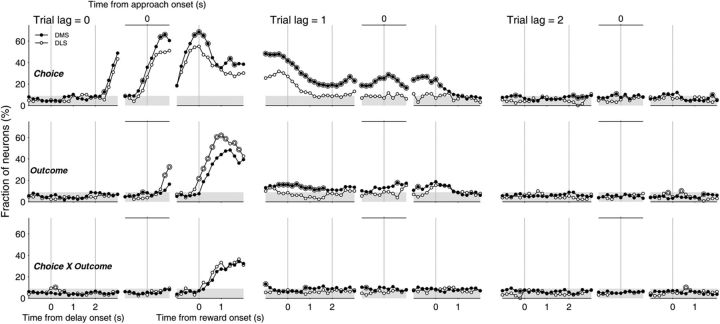
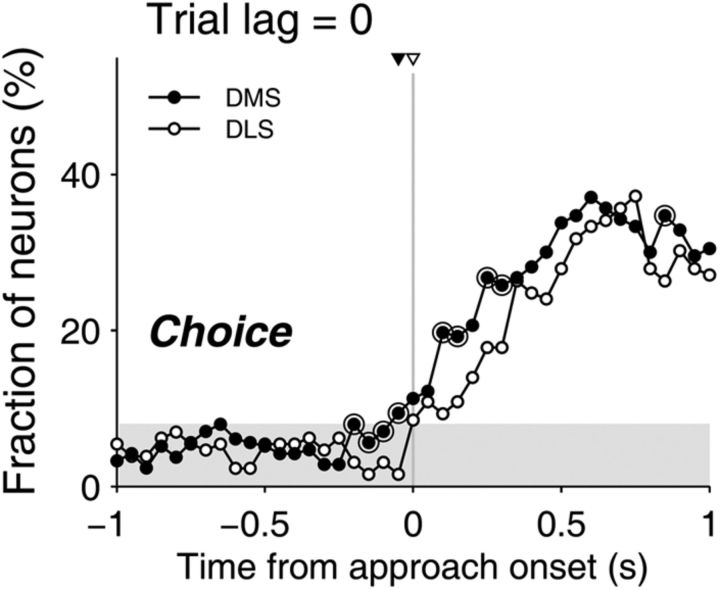
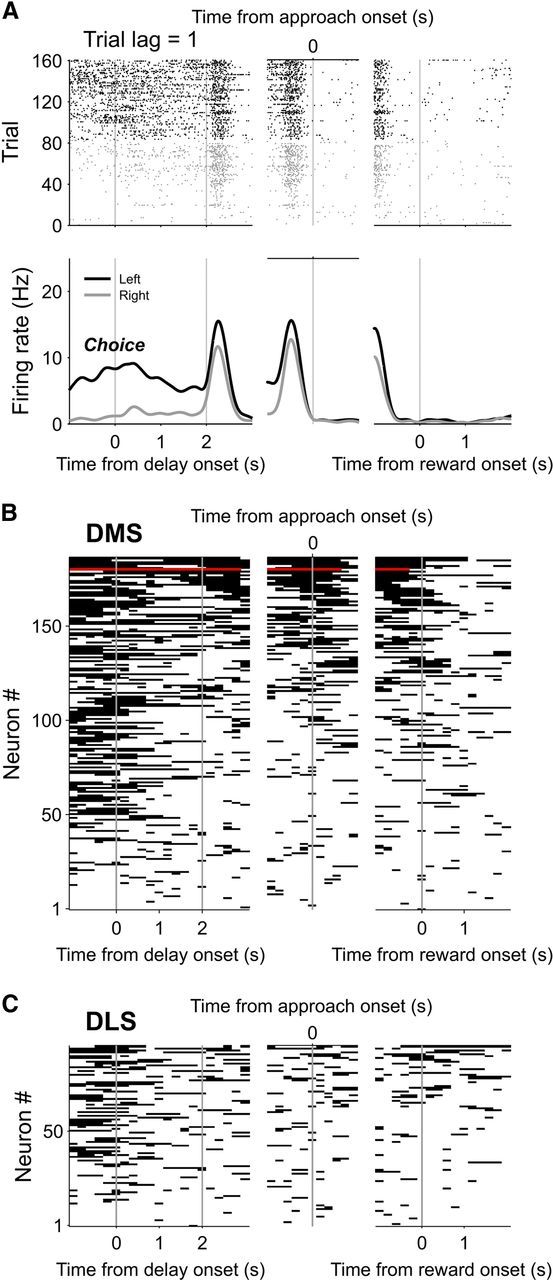
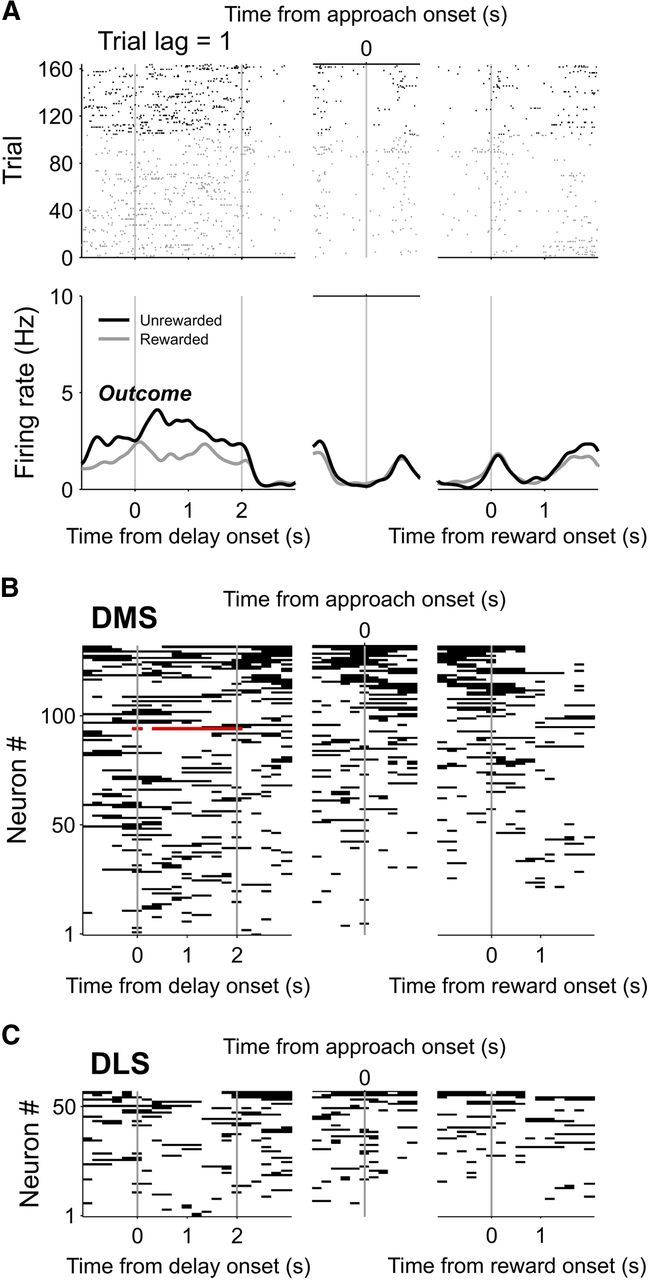
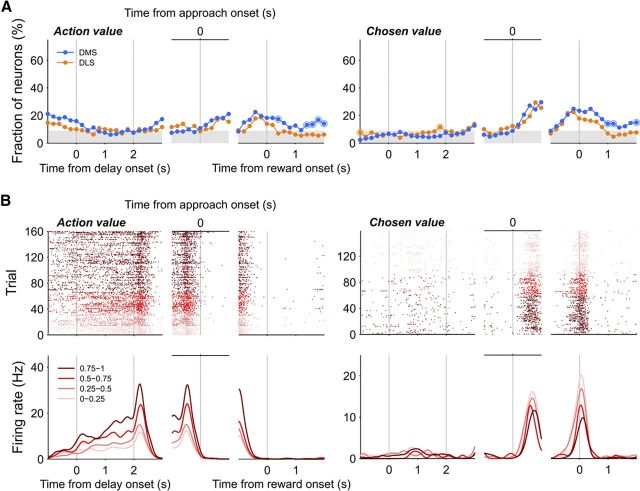
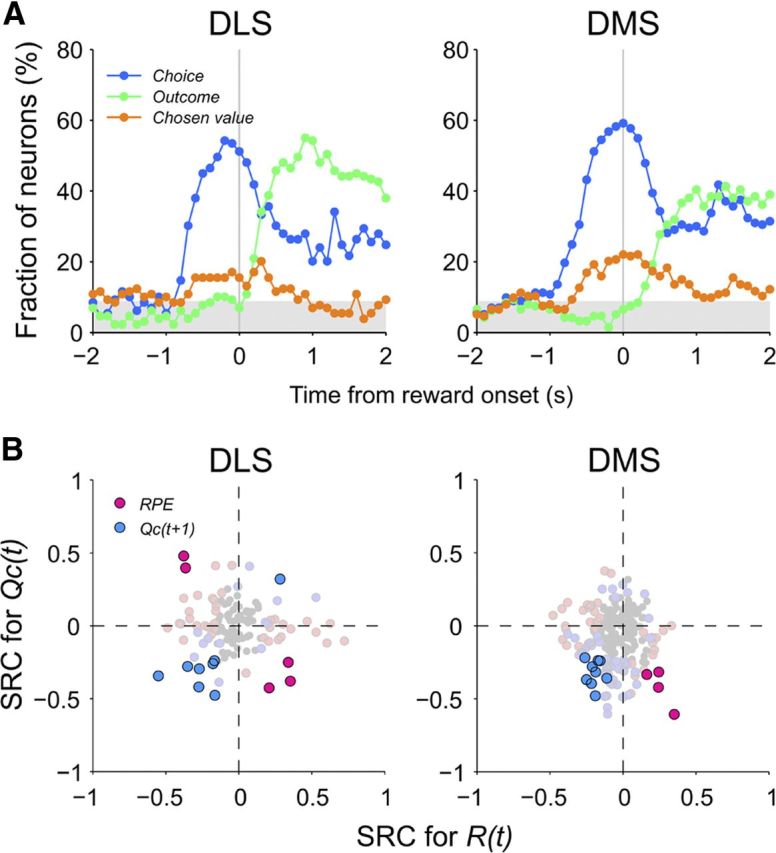
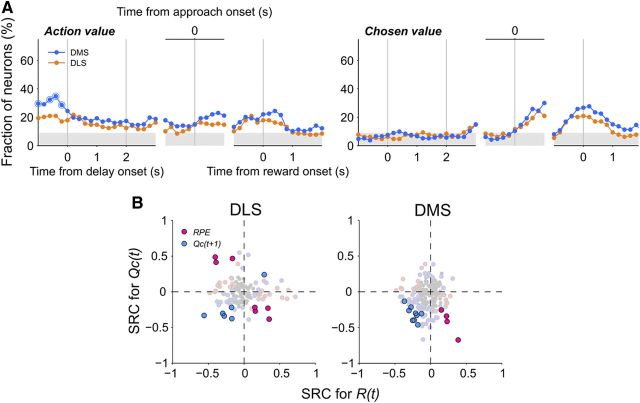
The cortico-basal ganglia network has been proposed to consist of parallel loops serving distinct functions. However, it is still uncertain how the content of processed information varies across different loops and how it is related to the functions of each loop. We investigated this issue by comparing neuronal activity in the dorsolateral (sensorimotor) and dorsomedial (associative) striatum, which have been linked to habitual and goal-directed action selection, respectively, in rats performing a dynamic foraging task. Both regions conveyed significant neural signals for the animal's goal choice and its outcome. Moreover, both regions conveyed similar levels of neural signals for action value before the animal's goal choice and chosen value after the outcome of the animal's choice was revealed. However, a striking difference was found in the persistence of neural signals for the animal's chosen action. Signals for the animal's goal choice persisted in the dorsomedial striatum until the outcome of the animal's next goal choice was revealed, whereas they dissipated rapidly in the dorsolateral striatum. These persistent choice signals might be used for causally linking temporally discontiguous responses and their outcomes in the dorsomedial striatum, thereby contributing to its role in goal-directed action selection.


Figures

Figure 1.
Figure 1.
Behavioral task, recording sites, and choice behavior. A, Dynamic foraging task. Rats were allowed to choose freely between two goals (blue circles) that delivered water probabilistically. The task was divided into delay (D), go (G), approach to reward (A), reward (Rw), and return (Rt) stages. The dotted lines indicate approximate boundaries between behavioral stages. The onset of the delay stage (blue dotted line) marks the beginning of a trial. Arrows indicate alternative movement directions. Scale bar, 10 cm. B, Recording sites. Each diagram is a coronal section view of the brain at 0.48 mm anterior to bregma for one rat (left hemisphere, n = 1 animal; right hemisphere, n = 2 animals). Circles represent estimated recording sites from which 1–5 single units were recorded simultaneously. Scale bar, 1 mm. Modified with permission from Elsevier (Paxinos and Watson, 1998). C, The probability to choose the left goal (PL) is plotted in moving average of 10 trials (gray, actual choice of the animal; black, PL given by a model-based RL algorithm) for one example recording session. Vertical lines indicate block transitions. Numbers at the top indicate reward probabilities. Tick marks indicate the animal's trial-by-trial choices (top, left choice; bottom, right choice; long, rewarded trial; short, unrewarded trial). D, The graphs show influences of recent within-trial choice-outcome pairs (left), pairs of previous choice outcome (t−1) and other choices (t−2 to t−5; center), and pairs of the previous choice (t−1) and other outcome pairs (t−2 to t−5; right) on the current choice of the animals. A positive coefficient indicates that a reward influenced the animal to repeat the same goal choice of a given choice-outcome pair. Asterisks indicate that the coefficients are statistically significant (t test, p < 0.05). Error bars are SEM.
Figure 2.
Figure 2.
Unit classification. Units were classified into putative MSNs and putative interneurons based on mean discharge rate during the entire recording session and the width of a filtered spike waveform. Left, Scatter plot for spike widths and mean discharge rates of all recorded units. Units were first grouped into high- (≥6.0 Hz) and low-rate (<6.0 Hz) units based on the distribution of mean firing rates of all units (right). The low-rate units were further divided into wide- (≥0.24 ms) and narrow-spiking (<0.24 ms) units based on the distribution of their spike widths (bottom). Those units with a low firing rate (<6.0 Hz) and a wide spike waveform (≥0.24 ms) were classified as putative MSNs and the rest were classified as putative interneurons. The latter are likely to consist of multiple cell types. Right, Example averaged spike waveforms of a putative MSN (left) and a putative interneuron (IntN, right).
Figure 3.
Figure 3.
Time courses of neural signals related to the animal's goal choice and its outcome. The graphs show fractions of neurons that significantly (t test, p < 0.05) modulated their activity according to the animal's choice, its outcome, and their interaction (Choice X Outcome) in the current (trial lag = 0) and two previous (trial lags = 1 and 2) trials estimated with a 1 s moving window advanced in 0.2 s steps (Eq. 2). The shading indicates the chance level for the DLS (binomial test, α = 0.05), which is slightly higher than that for the DMS. Vertical lines indicate the beginning and end of the delay stage (left panels), the beginning of the approach stage (middle panels) and the beginning of the reward stage (right panels). Large open circles denote significant differences between the DLS and DMS (χ2-text, p < 0.05).
Figure 4.
Figure 4.
Neural signals for upcoming goal choice. The fraction of neurons that significantly modulated their activity according to the current goal choice was examined in higher temporal resolution (100 ms moving window advanced in 50 ms time steps) around the approach onset. Large open circles denote significant differences between the DLS and DMS (χ2-text, p < 0.05). The triangles on top indicate the onset of the upcoming choice signals. It was 0 and 50 ms before the onset of the approach stage for the DLS (open triangle) and DMS (filled triangle), respectively.
Figure 5.
Figure 5.
Neural activity related to the animal's previous goal choice. A, An example DMS neuron that significantly modulated its activity according to the animal's previous goal choice (C(t−1)). Trials were grouped according to the animal's previous goal choice (left choice, black; right choice, gray). Top, Spike raster plot. Each row is one trial and each tick mark denotes an action potential. Bottom, Spike density functions estimated with a Gaussian kernel (σ = 100 ms). B, Summary of activity profiles of DMS neurons encoding the previous goal choice. All DMS neurons that significantly modulated their activity according to the animal's previous goal choice during at least one analysis window (1 s, advanced in 0.2 s steps) between the delay stage onset and the reward stage onset are shown. Each horizontal line segment indicates significant modulation of neural activity according to the previous goal choice in that window. Red color indicates the example neuron in A. Neurons were arranged according to the total duration of significant modulation. C, Activity profiles of all DLS neurons encoding the previous goal choice during at least one analysis window.
Figure 6.
Figure 6.
Neural activity related to the previous choice outcome. A, An example DMS neuron that significantly modulated its activity according to the previous choice outcome (R(t−1)). Trials were grouped according to the outcome of the animal's previous goal choice (rewarded, gray; unrewarded, black). Top, Spike raster plot. Bottom, Spike density functions (σ = 100 ms). B, Summary of activity profiles of all DMS neurons encoding the previous choice outcome during at least one analysis window. Same format as in Figure 5 except that the horizontal line segments indicate significant modulation of neural activity according to the previous choice outcome instead of the previous goal choice. Red color indicates the example neuron in A. C, Activity profiles of all DLS neurons encoding the previous choice outcome during at least one analysis window.
Figure 7.
Figure 7.
Neural activity related to values. A, Time courses of neural signals related to action value (QL(t) or QR(t)) and chosen value (Qc(t), Eq. 3). For the action value signals, fractions of those neurons that significantly modulated their activity according to at least one action value (left or right; corrected for multiple comparisons) were plotted. Same format as in Figure 3. B, Example neurons that significantly modulated their activity according to the left action value (QL(t), left, DLS neuron) or chosen value (right, DLS neuron). Trials were grouped according to quartiles of left action value (0∼1) or chosen value (0∼1), and indicated in different colors. Same format as in Figure 5A.
Figure 8.
Figure 8.
Computing RPE and updating chosen value in the striatum. A, Convergence of neural signals for the animal's goal choice (C(t)), its outcome (R(t)), and chosen value (Qc(t)) in the DLS and DMS. The graphs show fractions of neurons that significantly modulated their activity according to the animal's current goal choice (blue), its outcome (green), or chosen value (orange) around the time of reward delivery in an 0.5 s analysis window that was advanced in 0.1 s time steps (Eq. 3). B, Relationship between the coefficients related to choice outcome and chosen value. Standardized regression coefficients (SRC) for the current choice outcome (R(t)) were plotted against those for chosen value (Qc(t)) for neural activity during the first 1 s of the reward stage. Saturated colors indicate the neurons that significantly modulated their activity according to both choice outcome and chosen value, and light colors indicate those that encoded either choice outcome or chosen value only. The remaining neurons are indicated in gray. Red and blue indicate those neurons whose activity was better explained by the model containing RPE or updated chosen value (Qc(t+1); i.e., chosen value in trial t+1), respectively.
Figure 9.
Figure 9.
Value-related neural signals computed with a model-free RL algorithm. Action values were computed using the Rescorla–Wagner rule instead of the SP model. A, Neural signals for action value (QL(t) and/or QR(t)) and chosen value (Qc(t), Eq. 3). Same format as in Figure 7A. Action value signals were significant during the last 1 s of the delay stage in both the DLS (12.4%, binomial test, p < 0.001) and DMS (15.0%, p < 0.001). B, Relationship between the standardized regression coefficients related to choice outcome (R(t)) and chosen value (Qc(t)) for neural activity during the first 1 s of the reward stage (Eq. 3). Same format as in Figure 8B.

Similar articles

Cited by

References

    1. Alexander GE, Crutcher MD. Functional architecture of basal ganglia circuits: neural substrates of parallel processing. Trends Neurosci. 1990;13:266–271. - PubMed
    1. Alexander GE, DeLong MR, Strick PL. Parallel organization of functionally segregated circuits linking basal ganglia and cortex. Annu Rev Neurosci. 1986;9:357–381. - PubMed
    1. Alexander GE, Crutcher MD, DeLong MR. Basal ganglia-thalamocortical circuits: parallel substrates for motor, oculomotor, “prefrontal” and “limbic” functions. Prog Brain Res. 1990;85:119–146. - PubMed
    1. Baeg EH, Kim YB, Jang J, Kim HT, Mook-Jung I, Jung MW. Fast spiking and regular spiking neural correlates of fear conditioning in the medial prefrontal cortex of the rat. Cereb Cortex. 2001;11:441–451. - PubMed
    1. Baeg EH, Kim YB, Huh K, Mook-Jung I, Kim HT, Jung MW. Dynamics of population code for working memory in the prefrontal cortex. Neuron. 2003;40:177–188. - PubMed

Publication types

LinkOut - more resources