. 2013 Jan 2;33(1):79-92.
doi: 10.1523/JNEUROSCI.4101-12.2013.

Testing the sorption hypothesis in olfaction: a limited role for sniff strength in shaping primary odor representations during behavior

Affiliations

Testing the sorption hypothesis in olfaction: a limited role for sniff strength in shaping primary odor representations during behavior

Tristan Cenier et al. J Neurosci. .

Abstract

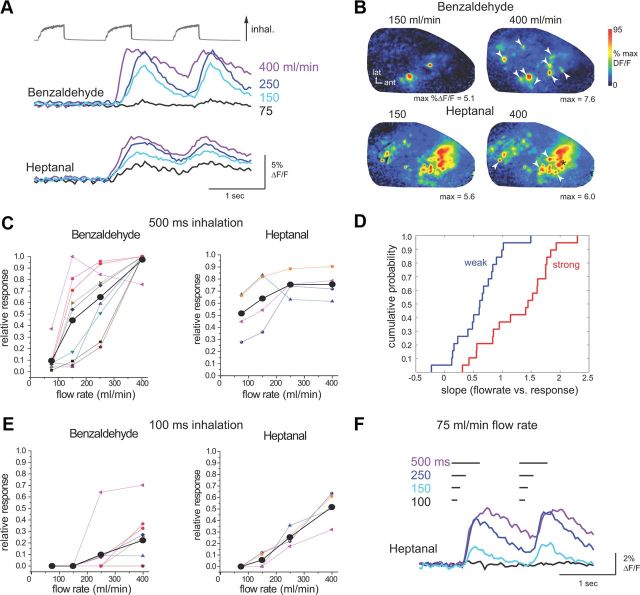
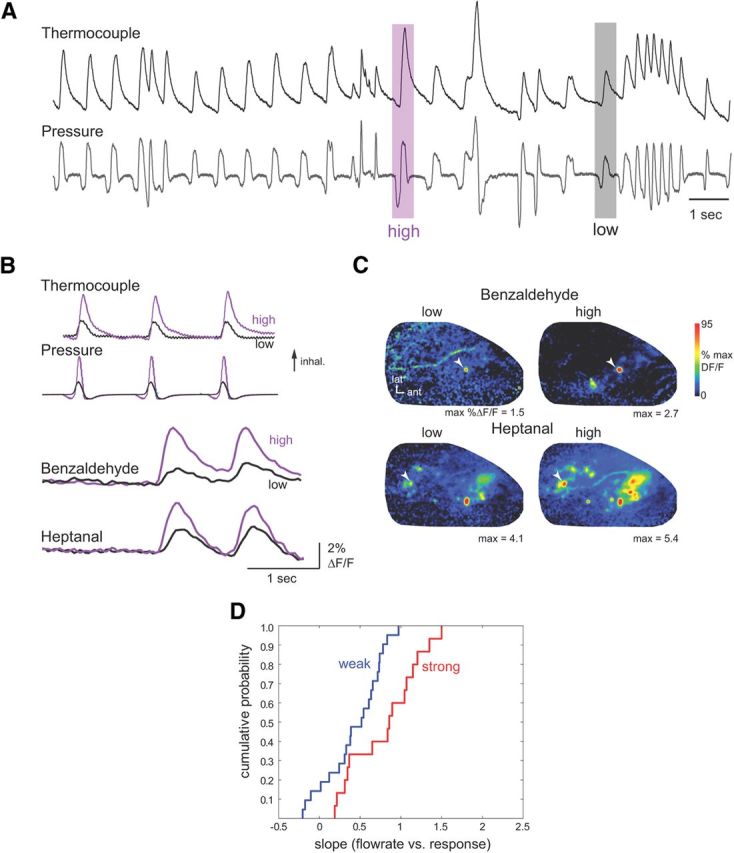
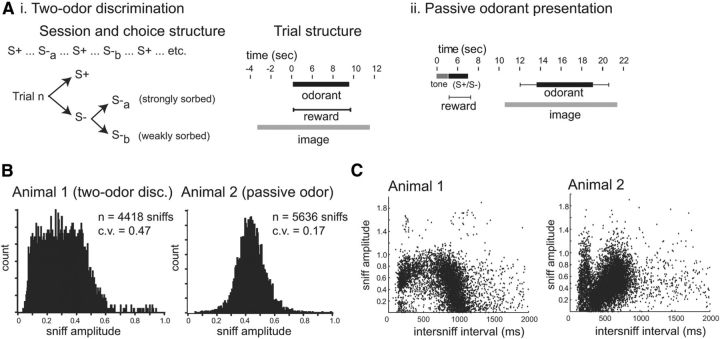
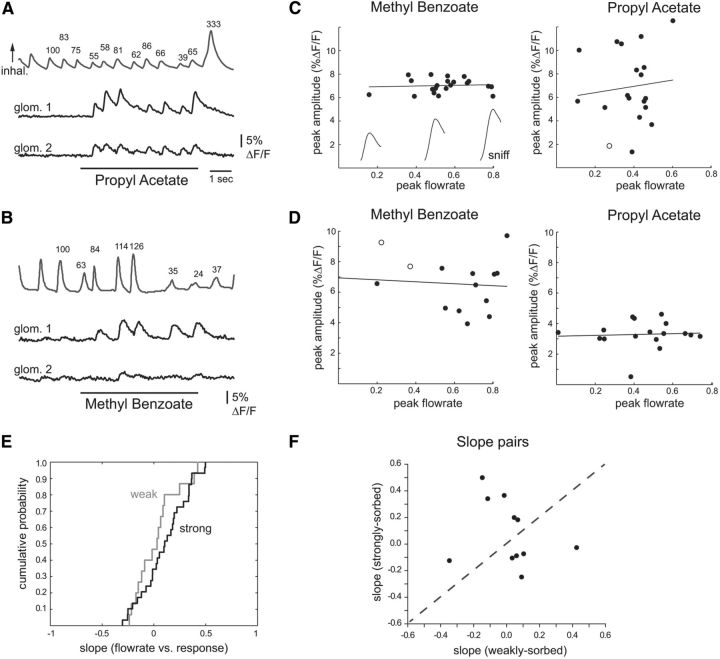
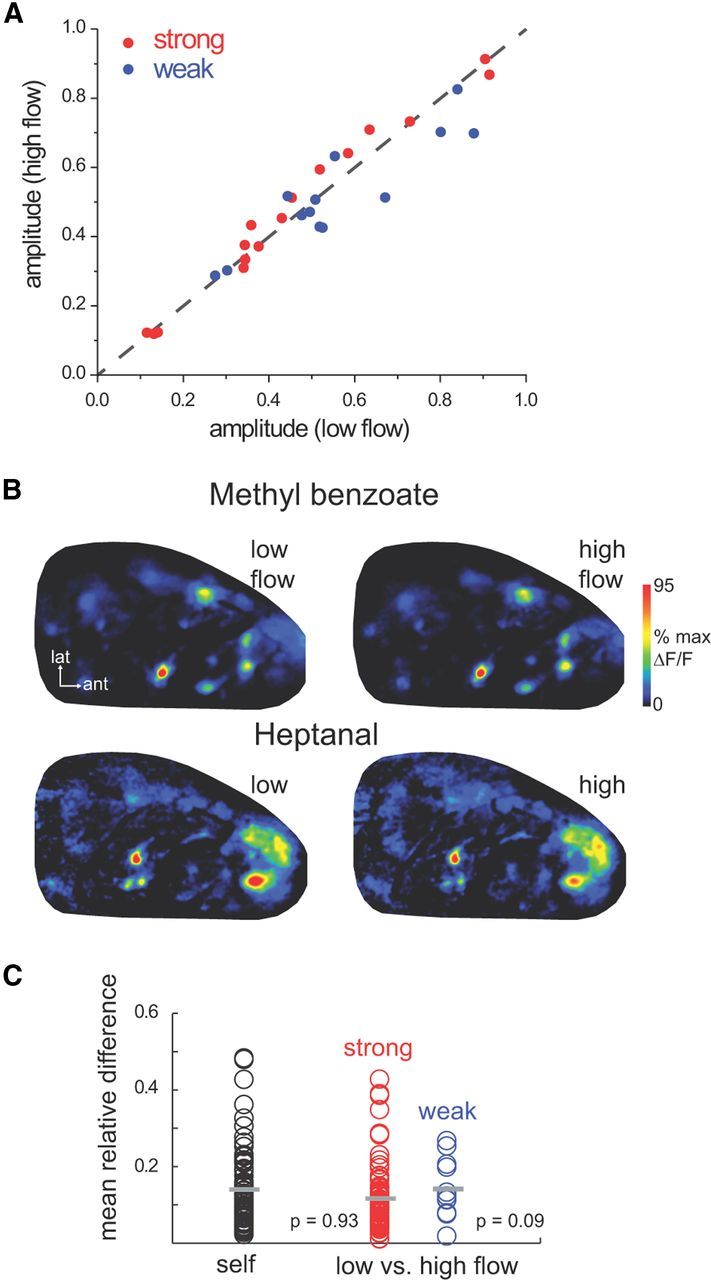
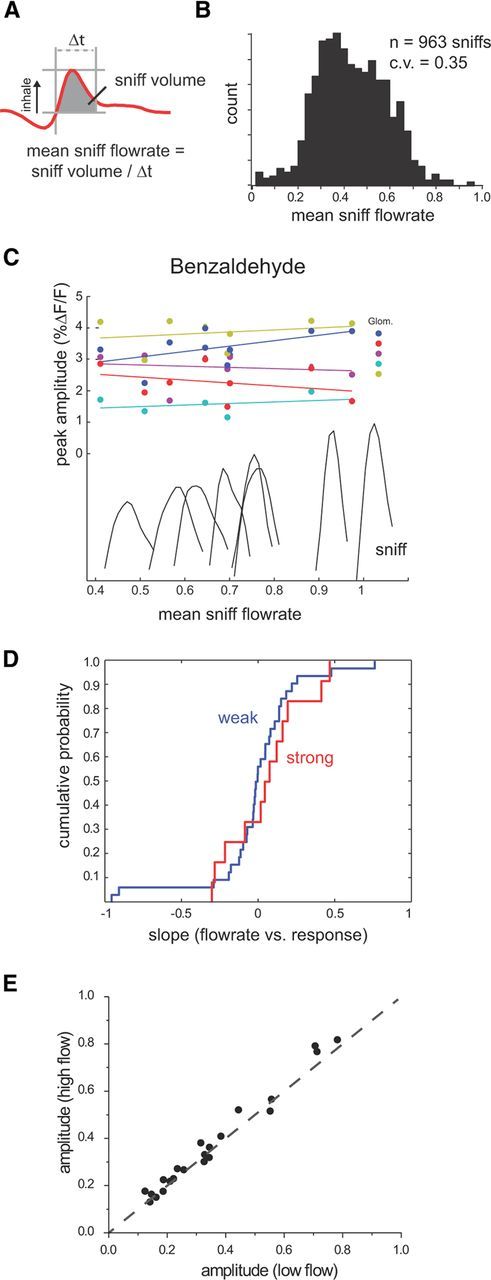
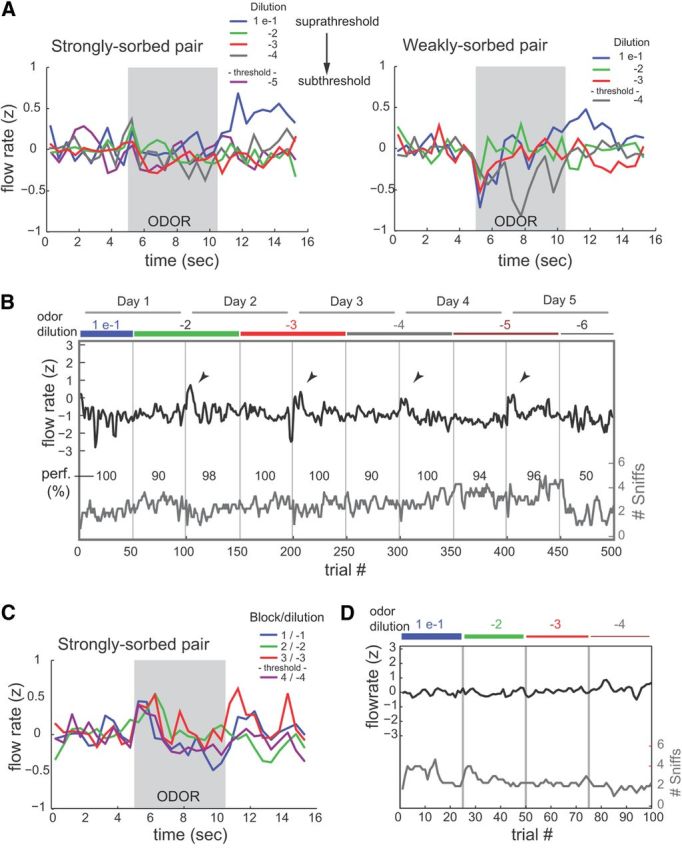
The acquisition of sensory information during behavior shapes the neural representation, central processing, and perception of external stimuli. In mammals, a sniff represents the basic unit of odor sampling, yet how sniffing shapes odor representations remains poorly understood. Perhaps the earliest hypothesis of the role of sniffing in olfaction arises from the fact that odorants with different physicochemical properties exhibit different patterns of deposition across the olfactory epithelium, and that these patterns are differentially affected by flow rate. However, whether sniff flow rates shape odor representations during natural sniffing remains untested, and whether animals make use of odorant sorption-airflow relationships as part of an active odor-sampling strategy remains unclear. We tested these ideas in the intact rat using a threefold approach. First, we asked whether sniff strength shapes odor representations in vivo by imaging from olfactory receptor neuron (ORN) terminals during controlled changes in inhalation flow in the anesthetized rat. Second, we asked whether sniff strength shapes odor representations by imaging from ORNs during natural sniffing in the awake rat. Third, we asked whether rats actively modulate sniff strength during an odor discrimination task. We found that, while artificial changes in flow rate can alter ORN responses, sniff strength has negligible effect on odor representations during natural sniffing, and behaving rats do not modulate flow rate to improve odor discrimination. These data suggest that modulating sniff strength does not shape odor representations sufficiently to be part of a strategy for active odor sensing in the behaving animal.


Figures

Figure 1.
Figure 1.
Odorant sorption affects flow-rate dependence of ORN responses during artificial inhalation. A, Presynaptic calcium signals imaged from ORNs in vivo during artificial inhalation of a strongly sorbed (benzaldehyde) and weakly sorbed (heptanal) odorant. Traces show calcium signal taken from one glomerulus during inhalation at increasing flow rates (indicated by numbers at right). Glomeruli are different for each odorant. Increasing flow rate leads to increased peak amplitude and decreased latency of responses. B, Peak response maps from the same preparation evoked by inhalation of each odorant at 150 and 400 ml/min. Each map is normalized to its own maximum. For each odorant, increasing flow rate activates additional glomeruli in the map. Arrowheads indicate glomeruli plotted in C; asterisk indicates glomerulus shown in F. C, Flow rate–response relationships plotted for multiple glomeruli activated by each odorant (same preparation as in A and B). Thick black plot shows mean response across activated glomeruli. Note that slope appears shallower for heptanal than for benzaldehyde. Response axis normalized to maximal response for each glomerulus. D, Cumulative probability distribution for normalized flow rate–response slopes for all glomeruli, plotted for weakly and strongly sorbed odorants. E, Flow rate–response plots for ORN inputs to the same glomeruli in the same preparation, but using shorter-duration (100 ms) inhalations. At this duration, the lowest flow rate (75 ml/min) fails to evoke inputs to any glomeruli. Also heptanal flow rate–response slopes are steeper and appear more linear than for longer-duration (500 ms) inhalations, indicating less saturation of ORN responses (see C). F, Calcium signals from one glomerulus (B, asterisk) showing responses to inhalations ranging in duration from 100 to 500 ms, using the lowest flow rate. Responses are nearly undetectable for 100 ms duration and begin to show saturation between 250 and 500 ms duration.
Figure 2.
Figure 2.
Sorption effects are weaker during playback of naturalistic sniffs in the anesthetized rat. A, Derivation of low and high flow rate “sniffs” from the awake rat. Traces show simultaneous measurements of intranasal airflow measured via a thermocouple (top trace) and intranasal pressure (lower trace) measured through the same cannula. Inward airflow and negative pressure (inhalation) are up. Purple and gray shaded boxes indicate inhalations generating low and high peak flow rates as measured via thermocouple. The corresponding pressure traces were used as command waveforms for sniff playback. See Materials and Methods for details. These boxes illustrate examples only; actual waveforms are shown in B. B, Presynaptic calcium signals from ORN input to a glomerulus evoked by playback of the low and high flow rate “sniffs” for benzaldehyde and heptanal. Top traces show intranasal airflow (thermocouple) and pressure measured during playback. Same animal as for artificial inhalation in Figure 1A–C. C, Peak response maps (same preparation) for both odorants, evoked by playback of low and high flow rate sniffs. Each map is normalized to its own maximum. For each odorant, the stronger sniff evokes input to more glomeruli and with increasing amplitude. Arrowheads indicate glomeruli plotted in B. Note that sniff playback evokes input to many fewer glomeruli than does 500 ms artificial inhalation (compare with Fig. 1B, maps). D, Cumulative probability distribution for flow rate–response slopes derived from the two sniff strengths (see Results, Materials and Methods for details) for all glomeruli, plotted for weakly and strongly sorbed odorants.
Figure 3.
Figure 3.
Measuring peak inhalation flow rate in the awake, head-fixed rat. Ai, Aii, Schematic of the lick/no lick, two-odor discrimination (Ai) and passive odorant presentations (Aii) paradigms. For the two-odor discrimination, S− trials were one of two odorants, one of which was strongly sorbed and one weakly sorbed. Imaging data were only collected on S− trials. For the passive paradigm, a tone signaled availability of water reward on all trials, and one of two odorants (strongly or weakly sorbed) was presented in between water presentations. See Materials and Methods for additional details. B, Distribution of peak flow rates (“sniff amplitude”) for all low-frequency (<2.5 Hz) inhalations in a behavioral session in two animals. Amplitude scale indicates operational range of flow-rate measurements (see Materials and Methods for details). C, Plots of sniff amplitude versus intersniff interval for the same two animals. Sniff amplitude distributions and amplitude–intersniff interval relationships varied across animals but were consistent across sessions in the same animal (data not shown).
Figure 4.
Figure 4.
Simultaneous measurement of inhalation flow and ORN-response amplitude in the awake rat. A, B, Intranasal airflow measurements (top trace) and presynaptic calcium signals from two ROIs measured simultaneously in awake, head-fixed rats for weakly sorbed propyl acetate (A) and strongly sorbed methyl benzoate (B). Numbers indicate amplitude of the thermocouple signal normalized to that of the first inhalation measured. A is from Animal 2 in Figure 3B (passive odorant presentation); B is from Animal 1 (2-odor discrimination). Note little correlation between relative inhalation amplitudes and ORN responses, especially for propyl acetate. C, D, Plots of ORN response versus peak flow rate for the first inhalation in all trials of one session for the animals in A and B, respectively. Plots are shown for both propyl acetate and methyl benzoate in each animal. Open circles indicate later inhalations occurring at >2 s intersniff interval. Plot in C also shows the thermocouple signal waveform for three inhalations of varying amplitude. Inhalation amplitudes are normalized to the operational range for that session (see Materials and Methods). Line shows linear fit to data. E, Cumulative probability distributions for flow rate–response slopes for the first inhalation of odorant in awake, head-fixed rats sampling weakly and strongly sorbed odorants. x-Axis is centered around zero slope. Flow rate–response slopes for strongly sorbed odorants are slightly but significantly higher than for weakly sorbed odorants (see Results for details). F, Flow–response slope pairs calculated for glomeruli activated by both a weakly and a strongly sorbed odorant in the same preparation.
Figure 5.
Figure 5.
Negligible effect of flow rate on ORN responses during natural odor sampling in the awake rat. A, Response amplitudes for ORN inputs to glomeruli (ROIs) evoked by low-flow and high-flow inhalations of weakly and strongly sorbed odorants, compiled across five sessions in three animals. Responses are normalized to the maximum response evoked in any glomerulus in that session. B, Example of “sniff-triggered average” ORN-response maps for all low-flow and high-flow inhalations in one session, calculated for strongly sorbed methyl benzoate and weakly sorbed heptanal. Each map is normalized to its own maximum. Maps are nearly identical for low-flow and high-flow inhalations. C, Mean difference between response maps evoked by low-flow and high-flow inhalations, calculated from “sniff-triggered average” maps.
Figure 6.
Figure 6.
ORN-response amplitudes are not shaped by mean inhalation flow rate during natural odor sampling. A, Schematic illustrating measurement of mean inhalation flow rate from intranasal pressure recordings in awake, head-fixed rats. Mean flow rate is estimated from inhalation volume (gray-shaded area) divided by inhalation duration (Δt). B, Histogram of mean flow rates measured in one behavioral session and scaled as for peak flow measurements. C, Plots of ORN response versus mean inhalation flow rate for the first inhalation in all trials of strongly sorbed benzaldehyde in one session. Responses are plotted for five glomeruli and normalized as in Figure 4C. Traces show the intranasal pressure waveform for each inhalation in the plot. Lines show linear fit to each data series. D, Cumulative probability distributions for mean flow rate–response slopes for first inhalations in awake, head-fixed rats sampling strongly sorbed (red) and other odorants (blue), normalized as in Figure 5A. E, Normalized response amplitudes for ORN inputs to glomeruli evoked by low-flow and high-flow inhalations of all odorants.
Figure 7.
Figure 7.
Head-fixed rats do not modulate sniff strength when performing a two-odor discrimination task. A, Plots of peak inhalation flow rate versus time relative to odor presentation for a rat performing lick/no-lick discriminations of a pair of strongly sorbed (methyl benzoate–benzaldehyde) or weakly sorbed (propyl acetate–amyl acetate) odorants. Peak flow rates are z-scored within each session, binned in 500 ms bins, and averaged across all trials within a block (100 trials). This rat shows a modest suppression in flow rate during odor presentation but no change as odorant concentrations decrease to below performance threshold. B, Peak flow rates for inhalations of odorant made before licking, plotted for all trials in one dilution series for the strongly sorbed pair methyl benzoate–benzaldehyde; different rat than A. Dilution blocks (blue) and session days are indicated above plot and demarcated by vertical lines. Red plot shows number of sniffs after odorant presentation and before mean lick time (median, 3). Numbers (perf) indicate performance per block, in percentage correct trials. Plots are smoothed with a 3 bin moving average for display. Note increase in flow rate for a few trials at the start of each day (arrowheads), but no change as concentration was decreased. C, D, Peak inhalation flow rate versus time (C) and flow versus trial (D) for a different rat in which odorant pair concentrations were decreased in successive blocks within one session (100 total trials, 25 trials per block).

References

    1. Adrian ED. Sensory discrimination with some recent evidence from the olfactory organ. Br Med Bull. 1950;6:330–333. - PubMed
    1. Amoore J, Buttery R. Partition coefficients and comparative olfactometry. Chem Senses and Flavour. 1978;3:57–71.
    1. Bozza TC, Kauer JS. Odorant response properties of convergent olfactory receptor neurons. J Neurosci. 1998;18:4560–4569. - PMC - PubMed
    1. Bozza T, Vassalli A, Fuss S, Zhang JJ, Weiland B, Pacifico R, Feinstein P, Mombaerts P. Mapping of class I and class II odorant receptors to glomerular domains by two distinct types of olfactory sensory neurons in the mouse. Neuron. 2009;61:220–233. - PMC - PubMed
    1. Carey RM, Wachowiak M. Effect of sniffing on the temporal structure of mitral/tufted cell output from the olfactory bulb. J Neurosci. 2011;31:10615–10626. - PMC - PubMed

Publication types

LinkOut - more resources