. 2013 Jan 2;33(1):187-200.
doi: 10.1523/JNEUROSCI.3214-12.2013.

Genetic analysis of synaptotagmin C2 domain specificity in regulating spontaneous and evoked neurotransmitter release

Affiliations

Genetic analysis of synaptotagmin C2 domain specificity in regulating spontaneous and evoked neurotransmitter release

Jihye Lee et al. J Neurosci. .

Abstract

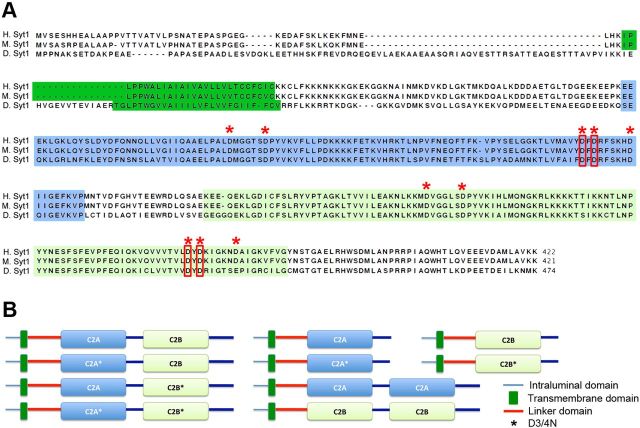
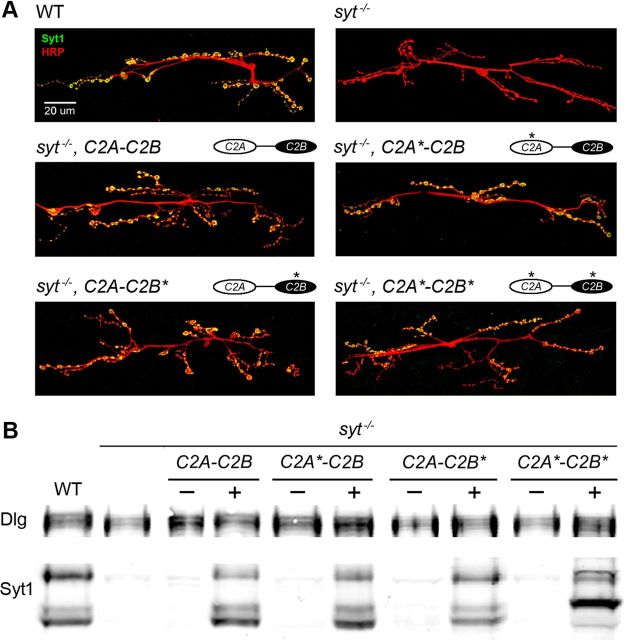
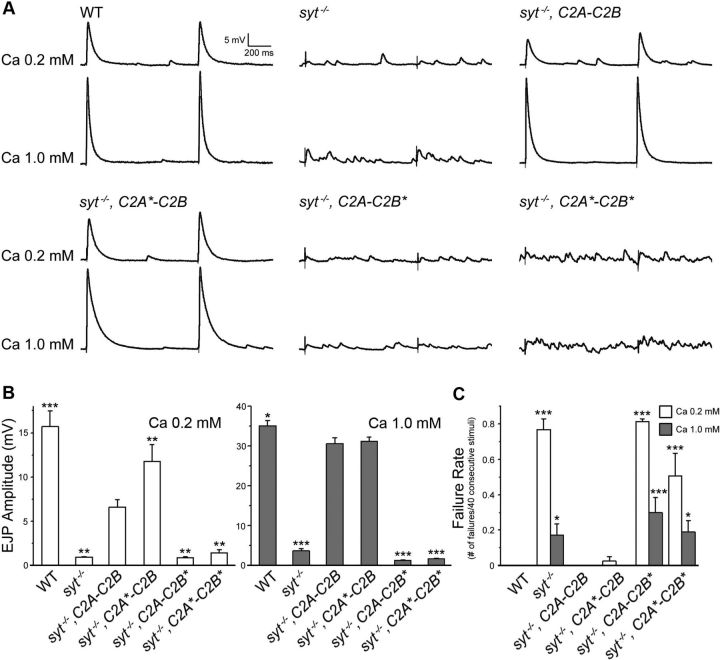
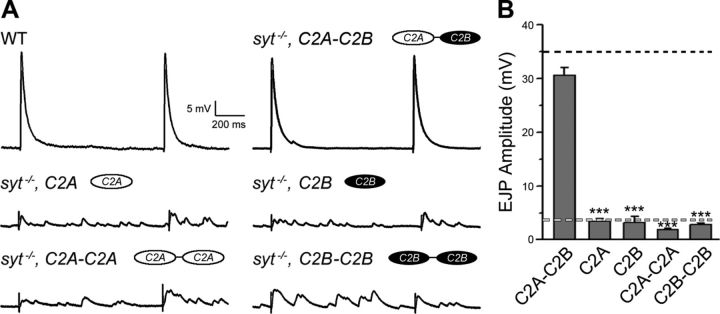
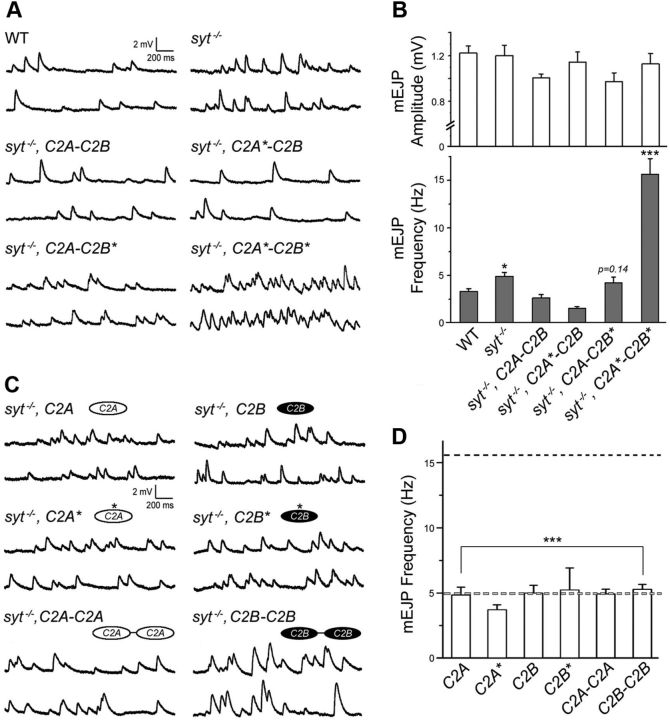
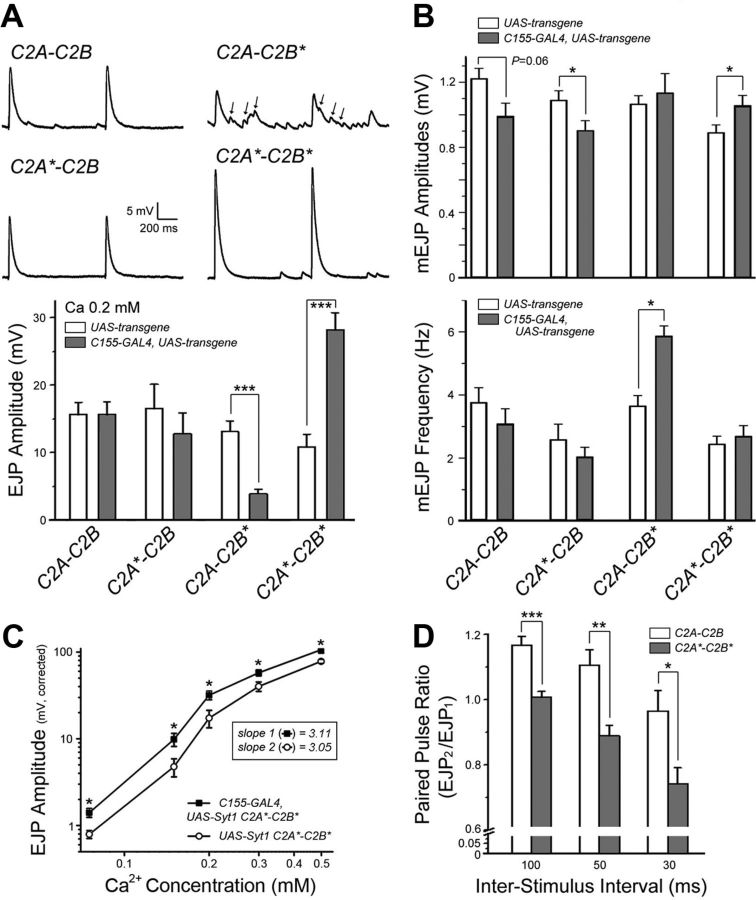
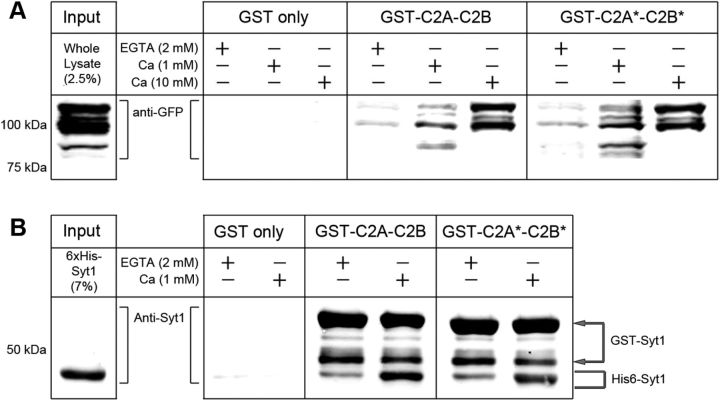
Synaptic vesicle fusion mediates communication between neurons and is triggered by rapid influx of Ca(2+). The Ca(2+)-triggering step for fusion is regulated by the synaptic vesicle transmembrane protein Synaptotagmin 1 (Syt1). Syt1 contains two cytoplasmic C2 domains, termed C2A and C2B, which coordinate Ca(2+) binding. Although C2A and C2B share similar topology, binding of Ca(2+) ions to the C2B domain has been suggested as the only critical trigger for evoked vesicle release. If and how C2A domain function is coordinated with C2B remain unclear. In this study, we generated a panel of Syt1 chimeric constructs in Drosophila to delineate the unique and shared functions of each C2 domain in regulation of synaptic vesicle fusion. Expression of Syt 1 transgenes containing only individual C2 domains, or dual C2A-C2A or C2B-C2B chimeras, failed to restore Syt1 function in a syt1(-/-) null mutant background, indicating both C2A and C2B are specifically required to support fast synchronous release. Mutations that disrupted Ca(2+) binding to both C2 domains failed to rescue evoked release, but supported synaptic vesicle docking and endocytosis, indicating that these functions of Syt1 are Ca(2+)-independent. The dual C2 domain Ca(2+)-binding mutant also enhanced spontaneous fusion while dramatically increasing evoked release when coexpressed with native Syt1. Together, these data indicate that synaptic transmission can be regulated by Syt1 multimerization and that both C2 domains of Syt1 are uniquely required for modulating Ca(2+)-independent spontaneous fusion and Ca(2+)-dependent synchronous release.


Figures

Figure 1.
Figure 1.
Syt1 transgenic constructs and sequence similarity. A, Amino acid sequences of human, mouse, and Drosophila Syt1 are compared. A single transmembrane domain and two C2 domains, C2A and C2B, are indicated as dark green, blue, and light green blocks, respectively. The five aspartate residues (D) involved in binding Ca2+ ions in each C2 domain are indicated with red asterisks. The third and fourth of these five aspartate residues were mutated to asparagines (N) to disrupt Ca2+-binding ability of each C2 domain (red boxes). B, The design of transgenic UAS-Syt1 constructs used for the analysis is shown. Syt1 consists of a short intraluminal region (blue line), a single transmembrane domain (dark green box), a cytoplasmic linker (red), two C2 domains (C2A, blue; C2B, green) with a short linker between them, and a C-terminal tail. *C2 domains containing mutations (described in A) (red boxes).
Figure 2.
Figure 2.
Expression of Syt1 transgenic constructs. A, Presynaptic distribution of Syt1 at the third instar larval NMJ is visualized by Syt1 immunoreactivity (green) in wild-type, syt1−/− (null), and syt1−/− animals rescued with the indicated transgenic constructs. The presynaptic nerve terminal is visualized with anti-HRP immunoreactivity (red) in a collapsed Z-stack confocal image stack. Scale bar, 20 μm. B, Western blot analysis is shown for the expression level of Syt1 in syt1−/− mutants rescued with the indicated transgenic constructs compared with endogenous Syt1 levels in controls (WT-left lane). The − lanes are extracts from animals lacking the neuronal GAL4 driver, while the + lanes are from extracts of animals containing the GAL4 driver. The levels of the Discs-large (Dlg) protein are compared as loading controls. Note that the C2A*-C2B* construct results in a change in the size of the protease-sensitive breakdown product previously described (Littleton et al., 1993).
Figure 3.
Figure 3.
Effects of Ca2+-binding mutations in each Syt1 C2 domain on evoked synchronous release. A, Representative traces of two consecutive eEJP responses are shown for wild-type, syt1−/− (null), and syt1−/− rescued with the indicated transgenic constructs. Example traces are shown for recordings at low (0.2 mm, top) and high (1.0 mm, bottom) [Ca2+] in HL3.1 saline. Calibration: 5 mV, 200 ms. B, The mean amplitude of EJP responses are summarized for each genotype indicated. C, Failure rates, calculated by counting trials with no detectable eEJP for 40 consecutive stimuli, are shown for each genotype. B, C, Data are mean ± SEM. ***p < 0.001, **p < 0.01, and *p < 0.05, one-way ANOVA with multiple comparisons using the Fisher's LSD test between syt1−/− rescued with the C2A-C2B and the indicated genotypes. Number of NMJs examined (0.2 and 1.0 mm [Ca2+]o): WT, 7 and 7; syt−/−, 6 and 16; syt−/−, C2A-C2B, 10 and 11; syt−/−, C2A*-C2B, 9 and 7; syt−/−, C2A-C2B*, 6 and 10; and syt−/−, C2A*-C2B*, 6 and 12.
Figure 4.
Figure 4.
Functional characterization of isolated or dual Syt1 C2 domains on synchronous release. A, Representative eEJPs recorded in the presence of high [Ca2+]o (1.0 mm) are shown for wild-type and syt1−/− rescued with the indicated transgenic constructs. B, Mean amplitude of eEJP responses are indicated for each genotype. The mean eEJP amplitude for wild-type and syt1 null mutants (compare Fig. 3B) are indicated with black and light gray dotted lines, respectively. Data are mean ± SEM. ***p < 0.001, one-way ANOVA with multiple comparisons using the Fisher's LSD test between syt1−/− rescued with the C2A-C2B (Fig. 3) and the indicated genotypes. Number of NMJs examined: syt−/−, C2A-C2B, 11; syt−/−, C2A, 6; syt−/−, C2B, 5; syt−/−, C2A-C2A, 7; and syt−/−, C2B-C2B, 13.
Figure 5.
Figure 5.
Contributions of Syt1 C2 domains to spontaneous synaptic release. A, Representative mEJPs recorded in the presence of low [Ca2+]o (0.2 mm) are shown for wild-type, syt1−/− (null), and syt1−/− rescued with the indicated transgenic constructs. Calibration: 2 mV, 200 ms. B, Summary data for mean mEJP amplitude (top) and frequency (bottom) are shown for the indicated genotypes. Data are mean ± SEM. ***p < 0.001 and *p < 0.05, one-way ANOVA with multiple comparison using the Fisher's LSD test between syt1−/− rescued with the C2A-C2B and the indicated genotypes. Number of NMJs examined: WT, 5; syt−/−, 19; syt−/−, C2A-C2B, 15; syt−/−, C2A*-C2B, 8; syt−/−, C2A-C2B*, 11; and syt−/−, C2A*-C2B*, 11. C, Representative mEJPs are shown for syt1−/− rescued with isolated C2 domains (C2A or C2B), with or without mutations in Ca2+-binding residues, or with dual C2A (C2A-C2A) or C2B (C2B-C2B) domains. D, Summary of mean mEJP frequency is shown for the indicated genotypes. The levels measured in syt1 null mutants (light gray) and syt1−/− rescued with Ca2+-binding defective C2A*-C2B* (black) are indicated with dotted lines. ***p < 0.001, one-way ANOVA analysis with multiple comparisons using the Fisher's LSD test between C2A*-C2B* (black dashed line) and the indicated genotypes. Number of NMJs examined: syt−/−, C2A, 5; syt−/−, C2A*, 6; syt−/−, C2B, 5; syt−/−, C2B*, 5; syt−/−, C2A-C2A, 7; and syt−/−, C2B-C2B, 18.
Figure 6.
Figure 6.
Role of the Syt1 C2B domain in regulation of synaptic vesicle size and density. A, Electron micrographs are shown for wild-type, syt1−/− (null), and syt1−/− rescued with Ca2+-binding defective C2 domains (C2A*-C2B*) or with dual C2B domains (C2B-C2B). Boxed regions in each micrograph are magnified 2.5 × in insets. Synaptic vesicles with abnormally large diameters are indicated with arrowheads. Scale bar, 500 nm. B, Summary of the mean mEJP amplitude is shown for syt1−/− as well as syt1−/− rescued with wild-type Syt1 (C2A-C2B), Ca2+-binding defective C2A*-C2B*, or dual C2A/C2B domains. Data for syt1−/− as well as syt1−/−, C2A-C2B and syt1−/−, C2A*-C2B* from Figure 5 are presented for comparison. Data are mean ± SEM. ***p < 0.001 and *p < 0.05, one-way ANOVA with multiple comparisons using the Fisher's LSD test between syt1−/− rescued with the C2A-C2B and the indicated genotypes. The number of NMJs examined for each genotype is listed in Figure 5. C, Cumulative diameter distributions of synaptic vesicles residing within a 100 nm radius of active zones are shown for syt1−/− as well as those rescued with wild-type, Ca2+-binding defective C2 domains, or dual C2B domains. A boxed inset is provided for a detailed comparison. D, E, The number of synaptic vesicles near or in the vicinity of active zones (D) and total synaptic vesicle density (E) are summarized for each genotype indicated. Data are mean ± SEM. ***p < 0.001 and **p < 0.01, one-way ANOVA with multiple comparisons using the Fisher's LSD test between syt1−/− rescued with the C2A-C2B and the indicated genotypes. Number of active zones analyzed for D and E: syt−/−, 24 and 14; syt−/−, C2A-C2B, 17 and 14; syt−/−, C2A*-C2B*, 13 and 5; and syt−/−, C2B-C2B, 22 and 14.
Figure 7.
Figure 7.
Interplay between endogenous and transgenic Syt1 constructs on evoked synchronous release. A, Top, Representative traces of two consecutive EJPs recorded in the presence of low [Ca2+]o (0.2 mm) are shown for wild-type larvae overexpressing the indicated transgenic Syt1 constructs. Calibration: 5 mV, 200 ms. Asynchronous release events during stimulation are indicated with arrows. (Bottom) Mean eEJP amplitude is summarized for the indicated genotypes. Animals carrying each transgenic construct without a GAL4-driver (white) served as controls for comparison with the same transgenic constructs driven by elavC155-GAL4 (gray). B, Mean mEJP amplitude (top) and frequency (bottom) are summarized for the indicated genotypes. A, B, Number of NMJs examined (control and transgene expression): C2A-C2B, 7 and 8; C2A*-C2B, 8 and 5; C2A-C2B*, 11 and 8; and C2A*-C2B*, 10 and 11. C, Log-log plot for eEJP amplitudes at varying [Ca2+]o is shown for animals overexpressing the C2A*-C2B* construct (■) and its transgenic control without a GAL4-driver (○). The slope values calculated from a linear fit of the first three data points (0.075–0.2 mm [Ca2+]o) are indicated in the box. Number of NMJs examined (control and transgene expression): 7 and 11 at 0.075 mm [Ca2+]o; 7 and 11 at 0.15 mm; 6 and 11 at 0.2 mm; 6 and 10 at 0.3 mm; and 6 and 9 at 0.5 mm. D, The ratios of eEJP responses in a paired-pulse stimulation paradigm are displayed for wild-type animals overexpressing the C2A-C2B (white) or C2A*-C2B* (gray) constructs. Number of NMJs examined (C2A-C2B and C2A*-C2B*): 8 and 6 at 30 ms interval; 8 and 7 at 50 ms; and 8 and 7 at 100 ms. A–D, Data are mean ± SEM. ***p < 0.001, **p < 0.01, and *p < 0.05, Student's t test for control (UAS-transgene) versus neuronal expression (C155-GAL4, UAS-transgene) (A–C) or for neuronal overexpression of C2A-C2B versus C2A*-C2B* (D).
Figure 8.
Figure 8.
Similar distributions of synaptic vesicles and release sites between animals overexpressing wild-type and Ca2+-binding defective Syt1. A, Electron micrographs are shown for larvae overexpressing the wild-type (C2A-C2B, top) or Ca2+-binding defective (C2A*-C2B*, bottom) Syt1 constructs. Detailed view near a single active zone is shown on the right panels. Scale bar, 100 nm. B, Mean number of synaptic vesicles at varying distances from active zones is shown for larvae overexpressing the wild-type or Ca2+-binding defective Syt1 constructs. Number of active zones analyzed (C2A-C2B and C2A*-C2B*): 13 and 25 at 50 nm; 19 and 32 at 100–200 nm; 15 and 16 for total number of synaptic vesicles. C, Representative confocal images depicting distributions of release sites (active zones) in muscle 6/7 NMJs are shown for larvae overexpressing wild-type or Ca2+-binding defective Syt1. Active zones are identified by immunoreactivity against Brp (top panels, green). The overall structure of NMJs is detected with HRP immunoreactivity (middle panels, red). The merged images of Brp and HRP channels are shown in the bottom panels. Scale bar, 20 μm. D, The mean number of active zones per NMJ is summarized for larvae containing each transgenic construct without a GAL4 driver (white, control) and those with transgenic constructs driven by elavC155-GAL4 (gray). Number of NMJs examined (control and transgene expression): 12 and 11 for C2A-C2B; 11 and 10 for C2A*-C2B*. B, D, Data are mean ± SEM.
Figure 9.
Figure 9.
Multimerization of wild-type and C2A*-C2B* Syt1. A, Western blot with anti-GFP antibodies is shown to demonstrate Ca2+-independent and Ca2+-dependent binding of endogenous GFP-tagged Syt1, purified from adult head lysates, to GST-fused wild-type (C2A-C2B) or Ca2+-binding defective (C2A*-C2B*) Syt1. Fly head extracts are incubated with GST-fused Syt1 in the absence (EGTA, 2 mm) or presence of Ca2+ (1 or 10 mm). B, Binding of purified wild-type Syt1-His6 to wild-type or Ca2+-binding defective GST-Syt1. GST-Syt1 (C2A-C2B and C2A*-C2B*) and interacting wild-type Syt1-His6 products are indicated with arrows (top two bands) and a bracket (a single bottom band), respectively.

References

    1. Bai J, Earles CA, Lewis JL, Chapman ER. Membrane-embedded synaptotagmin penetrates cis or trans target membranes and clusters via a novel mechanism. J Biol Chem. 2000;275:25427–25435. - PubMed
    1. Bai J, Wang P, Chapman ER. C2A activates a cryptic Ca(2+)-triggered membrane penetration activity within the C2B domain of synaptotagmin I. Proc Natl Acad Sci U S A. 2002;99:1665–1670. - PMC - PubMed
    1. Bai J, Wang CT, Richards DA, Jackson MB, Chapman ER. Fusion pore dynamics are regulated by synaptotagmin*t-SNARE interactions. Neuron. 2004;41:929–942. - PubMed
    1. Bennett MK, Calakos N, Scheller RH. Syntaxin: a synaptic protein implicated in docking of synaptic vesicles at presynaptic active zones. Science. 1992;257:255–259. - PubMed
    1. Brand AH, Perrimon N. Targeted gene expression as a means of altering cell fates and generating dominant phenotypes. Development. 1993;118:401–415. - PubMed

Publication types

LinkOut - more resources