. 2013 Jan 2;33(1):201-13.
doi: 10.1523/JNEUROSCI.3248-12.2013.

The human bitter taste receptor TAS2R10 is tailored to accommodate numerous diverse ligands

Affiliations

The human bitter taste receptor TAS2R10 is tailored to accommodate numerous diverse ligands

Stephan Born et al. J Neurosci. .

Abstract

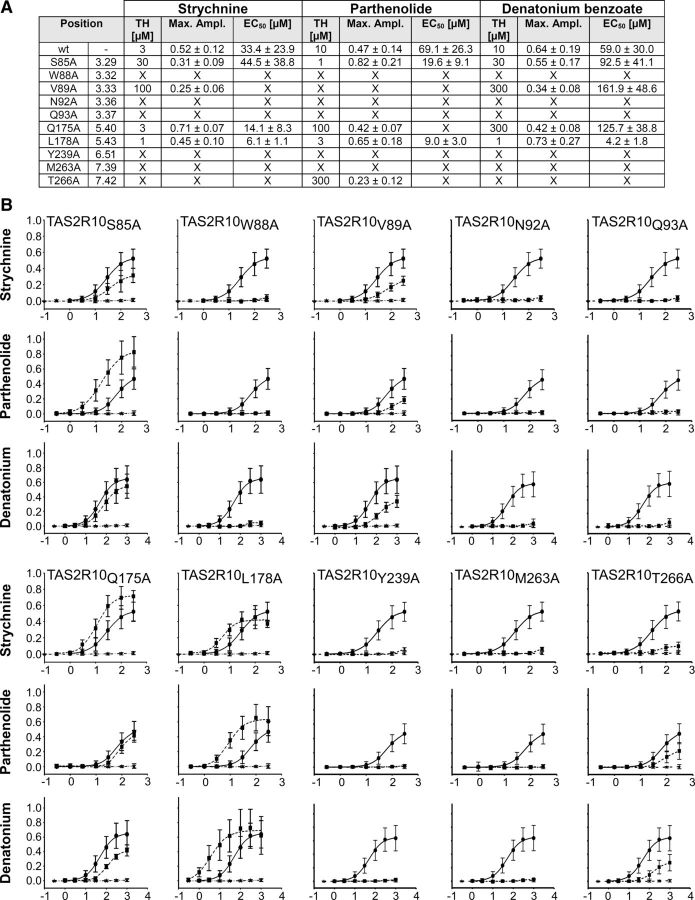
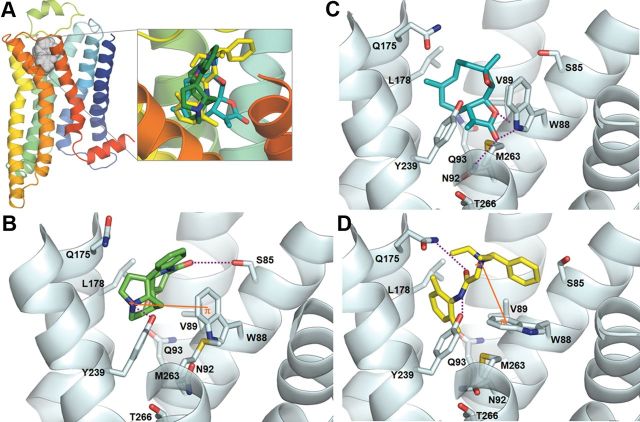
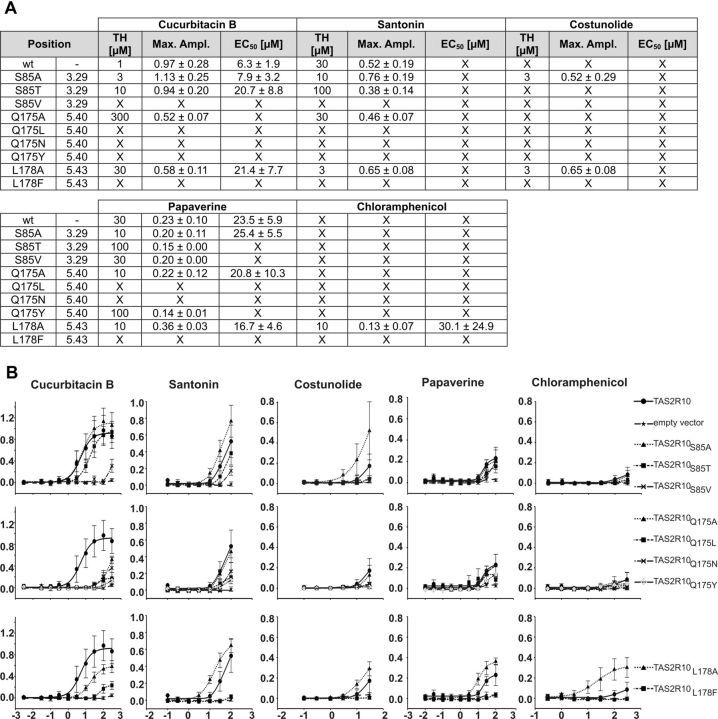
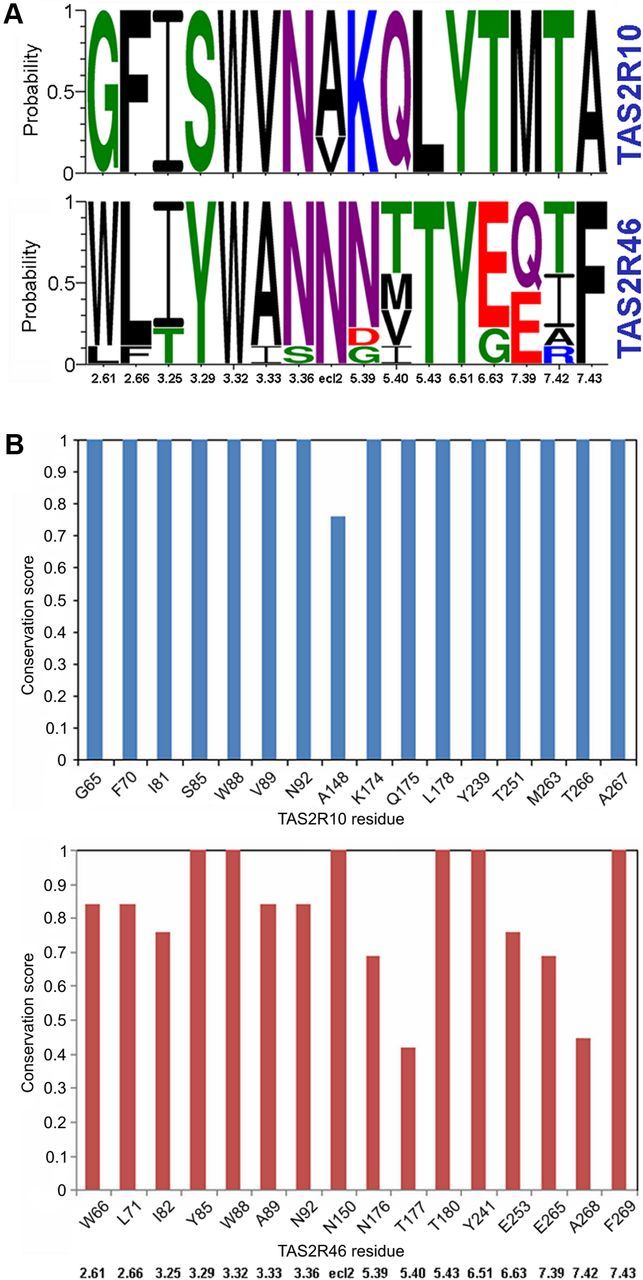
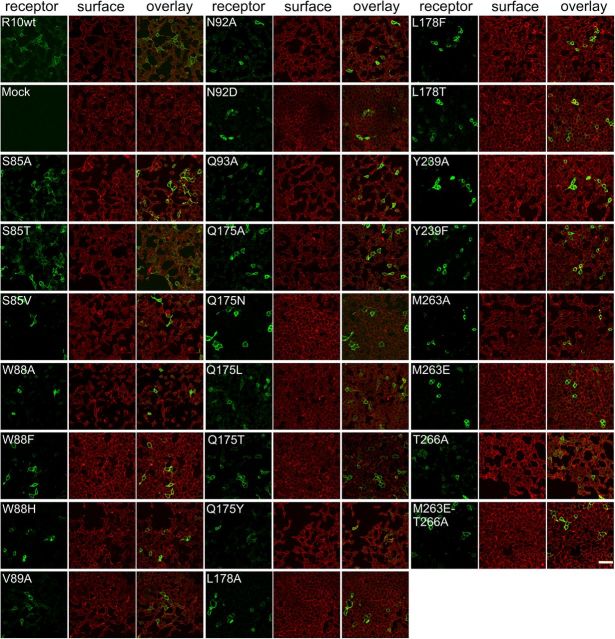
Bitter taste is a basic taste modality, required to safeguard animals against consuming toxic substances. Bitter compounds are recognized by G-protein-coupled bitter taste receptors (TAS2Rs). The human TAS2R10 responds to the toxic strychnine and numerous other compounds. The mechanism underlying the development of the broad tuning of some TAS2Rs is not understood. Using comparative modeling, site-directed mutagenesis, and functional assays, we identified residues involved in agonist-induced activation of TAS2R10, and investigated the effects of different substitutions on the receptor's response profile. Most interestingly, mutations in S85(3.29) and Q175(5.40) have differential impact on stimulation with different agonists. The fact that single point mutations lead to improved responses for some agonists and to decreased activation by others indicates that the binding site has evolved to optimally accommodate multiple agonists at the expense of reduced potency. TAS2R10 shares the agonist strychnine with TAS2R46, another broadly tuned receptor. Engineering the key determinants for TAS2R46 activation by strychnine in TAS2R10 caused a loss of response to strychnine, indicating that these paralog receptors display different strychnine-binding modes, which suggests independent acquisition of agonist specificities. This implies that the gene duplication event preceding primate speciation was accompanied by independent evolution of the strychnine-binding sites.


Figures

Figure 1.
Figure 1.
Locating the TAS2R10 agonist binding pocket. A, The structure-based multiple sequence alignment of the modeled TAS2R10 receptor and the template crystal structure of β2 adrenergic receptor–Gs-protein complex with bound agonist (PDB code 3SN6) was generated by the Expresso server (http://www.tcoffee.org/). The most conserved residue in each helix is shaded yellow and is indicated by its Ballesteros-Weinstein numbering. Identical residues are in red, and similar residues are in blue. B, Top view of a TAS2R10 homology model based on the crystal structure of the agonist-bound state of the β-adrenergic receptor–Gs-protein complex (Rasmussen et al., 2011). The TMs are shown as ribbons. The circled area with a radius of ∼6Å was centered at N923.36 located at the bottom center of the putative agonist binding pocket. Amino acid residues whose side-chains were located within the indicated radius and oriented toward the extracellular side with respect to position N92 (highlighted and labeled) were subjected to alanine-scanning mutagenesis. C, Snake plot of TAS2R10. Residues corresponding to the most conserved positions in each TM (positions X.50 according to the Ballesteros-Weinstein numbering system) are indicated in black. Positions subjected to alanine-scanning mutagenesis are shown in gray and circled with white lines. TMs are numbered by Roman numerals. Membrane, N terminus (NH2), C terminus (COOH), extracellular (ec1-ec3), and intracellular loops (ic1-ic3) are labeled.
Figure 2.
Figure 2.
Functional characterization of receptor constructs obtained by alanine-scanning mutagenesis. A, In the left columns, the mutated residue is indicated and its position according to the Ballesteros-Weinstein numbering system is given. For the agonists, strychnine, parthenolide, and denatonium benzoate, threshold concentrations (TH), maximal signal amplitudes as ΔF/F values (Max ampl), and EC50 concentrations are given. X = no statistically significant value above mock-control. B, Dose–response relations obtained for TAS2R10 mutants. Plots obtained for TAS2R10 wild-type (circles, solid lines), TAS2R10 mutants (squares, broken lines), and empty vector (stars, broken lines) are compared within each graph. y-Axis, relative changes in fluorescence (ΔF/F); x-axis, decadic logarithm of the agonist concentration given in μm.
Figure 3.
Figure 3.
Detailed analysis of the agonist selective receptor positions S853.29 and Q1755.40. A, In the left columns, the mutated residue is indicated and its position according to the Ballesteros-Weinstein numbering system is given. For the agonists, strychnine, parthenolide, and denatonium benzoate, threshold concentrations (TH), maximal signal amplitudes as ΔF/F values (Max ampl), and EC50 concentrations are given. X = no statistically significant value above mock-control. B, Dose–response curves of constructs challenged with different concentrations of strychnine, parthenolide, and denatonium benzoate. Changes in fluorescence after agonist stimulation (ΔF/F; y-axis) were monitored and plotted together with the corresponding agonist concentration (decadic logarithm of the agonist concentration given in μm). Plots obtained for TAS2R10 wild-type (circles, solid lines), TAS2R10 mutants (squares, broken lines), and empty vector (stars, broken lines) are compared within each graph.
Figure 4.
Figure 4.
Mode of interaction between TAS2R10 and strychnine, parthenolide, and denatonium benzoate. A, Homology model of TAS2R10 viewed perpendicular to the plasma membrane, with the extracellular side of the receptor shown on top and the intracellular side shown on the bottom of the figure. The structure is represented as ribbons and colored from the N-terminal (blue) to the C-terminal (red) amino acid sequence. The predicted binding site is shown in gray and is located among TMs III to VII. The inset shows an overlay of the three docked agonists in the binding site. B–D, The proposed docked conformations of strychnine (B), parthenolide (C), and denatonium (D) are shown in a side view. Agonists (strychnine, green; parthenolide, cyan; and denatonium, yellow) and receptor residues (light gray) involved in interactions are shown in stick representation. Dashed purple lines indicate hydrogen bonds; and orange lines, π-cation interactions. Part of TM IV is not shown for clarity.
Figure 5.
Figure 5.
Verification of agonist docking results. A, In the left columns, the mutated residue is indicated and its position according to the Ballesteros-Weinstein numbering system is given. For the agonists, strychnine, parthenolide, and denatonium benzoate, threshold concentrations (TH), maximal signal amplitudes as ΔF/F values (Max ampl), and EC50 concentrations are given. X = no statistically significant value above mock-control. B, Dose–response curves of constructs challenged with different concentrations of strychnine, parthenolide, and denatonium benzoate. Changes in fluorescence after agonist stimulation (ΔF/F; y-axis) were monitored and plotted together with the corresponding agonist concentration (decadic logarithm of the agonist concentration given in μm). Plots obtained for TAS2R10 wild-type (●), TAS210L178F (▴), TAS2R10L178T (■), TAS2R46 (×), and empty vector (★) are compared within each graph.
Figure 6.
Figure 6.
Further characterization of the agonist-selective positions 85, 175, and 178. A, In the left columns, the mutated residue is indicated and its position according to the Ballesteros-Weinstein numbering system is given. For the agonists, cucurbitacin B, santonin, costunolide, papaverine, and chloramphenicol, threshold concentrations (TH), maximal signal amplitudes as ΔF/F values (Max ampl), and EC50 concentrations are given. X = no statistically significant value above mock-control. B, Dose–response curves of constructs challenged with different concentrations of cucurbitacin B, santonin, costunolide, papaverine, and chloramphenicol. Changes in fluorescence after agonist stimulation (ΔF/F; y-axis) were monitored and plotted together with the corresponding agonist concentration (decadic logarithm of the agonist concentration given in μm). Plots obtained for TAS2R10 wild-type and the indicated TAS2R10 mutants generated for receptor positions 85, 175, and 178 are compared within the graphs.
Figure 7.
Figure 7.
Comparison of the strychnine-binding modes in TAS2R10 and TAS2R46. A, B, Dose–response curves of constructs challenged with different concentrations of strychnine (top), parthenolide (middle), and denatonium benzoate (bottom). Changes in fluorescence after agonist stimulation (ΔF/F; y-axis) were monitored and plotted together with the corresponding agonist concentration (decadic logarithm of the agonist concentration given in μm). A, Dose–response curves obtained for TAS2R10 wild-type, TAS2R10M263E, TAS210M263E T266A, TAS2R10T266A, TAS2R46 wild-type, and empty vector are compared within each graph. B, Comparison of dose–response curves for TAS2R10 wild-type, TAS2R10Q175T, and empty vector. C, D, Strychnine-binding modes in the 7TM-bundle binding site of TAS2R10 (C) and TAS2RR46 (D). The receptor is represented as ribbons with TMs labeled in Roman numerals. The agonist is represented as green sticks. Interacting residues are shown as sticks and labeled. Dashed purple lines indicate hydrogen bonds; and orange lines, π-cation interactions. E, Amino acid sequence alignment of TAS2R10 and TAS2R46. The most conserved residue in each helix is shaded yellow and is indicated by its Ballesteros-Weinstein numbering. Identical residues are in red and similar residues are in blue.
Figure 8.
Figure 8.
Sequence conservation analysis of TAS2R10 and TAS2R46. A, Conservation of TAS2R10 and TAS2R46 binding site residues in human and 8 primate protein sequences visualized using Weblogo. The y-axis shows the probability of each residue in a stack. The residue position is indicated on the x-axis by its Ballesteros-Weinstein number. Green represents polar residues; purple, neutral; blue, basic; red, acidic; and black, hydrophobic. Sequence logo generated by WebLogo3.0. B, Conservation of each of the binding site residues among the human and 8 primate sequences as calculated by the ScoreCons server. The residue position in human is indicated on the x-axis, and the corresponding BW number is shown below the plots. The y-axis shows the conservation score (maximal score of 1 corresponds to 100% sequence identity of the aligned positions).
Figure 9.
Figure 9.
Immunocytochemical staining of TAS2R10 constructs. HEK 293T Gα16gust44 cells were transiently transfected with constructs coding for TAS2R10 and TAS2R10 mutants. The receptors (green) were visualized using an anti-HSV tag antiserum. The cell surface (red) was stained with concanavalin A. For each construct (indicated in the top left corner), a series of three images is shown: left, receptor construct; middle, cell surface; right, overlay of receptor and cell surface staining. Scale bar, 50 μm. Images were taken with a confocal laser scanning microscope.

Similar articles

Cited by

References

    1. Adler E, Hoon MA, Mueller KL, Chandrashekar J, Ryba NJ, Zuker CS. A novel family of mammalian taste receptors. Cell. 2000;100:693–702. - PubMed
    1. Armougom F, Moretti S, Poirot O, Audic S, Dumas P, Schaeli B, Keduas V, Notredame C. Expresso: automatic incorporation of structural information in multiple sequence alignments using 3D-Coffee. Nucleic Acids Res. 2006;34:W604–W608. - PMC - PubMed
    1. Ballesteros J, Weinstein H. Integrated methods for the construction of three-dimensional models of structure–function relations in G-protein-coupled receptors. Methods Neurosci. 1995;25:366–428.
    1. Behrens M, Brockhoff A, Kuhn C, Bufe B, Winnig M, Meyerhof W. The human taste receptor hTAS2R14 responds to a variety of different bitter compounds. Biochem Biophys Res Commun. 2004;319:479–485. - PubMed
    1. Behrens M, Bartelt J, Reichling C, Winnig M, Kuhn C, Meyerhof W. Members of RTP and REEP gene families influence functional bitter taste receptor expression. J Biol Chem. 2006;281:20650–20659. - PubMed

Publication types

LinkOut - more resources