

Comprehensive analysis of LC/MS data using pseudocolor plots
- PMID: 23283727
- PMCID: PMC4141469
- DOI: 10.1007/s13361-012-0524-6
Comprehensive analysis of LC/MS data using pseudocolor plots
Abstract
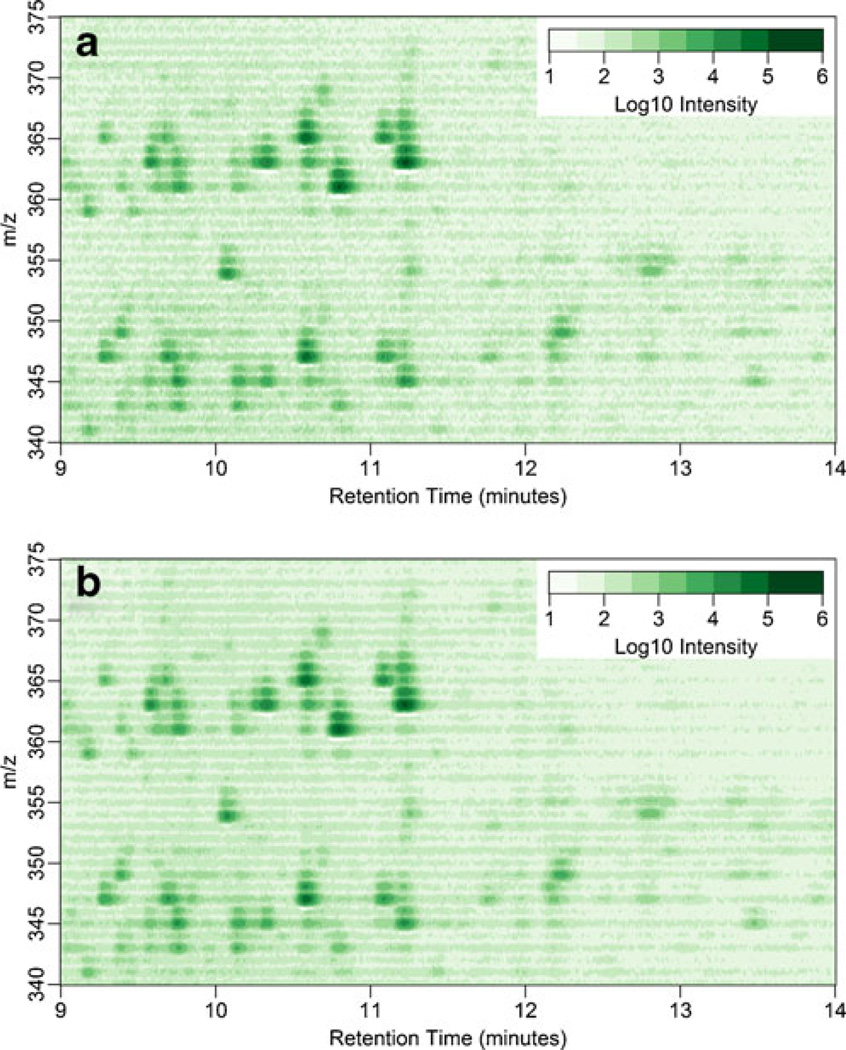
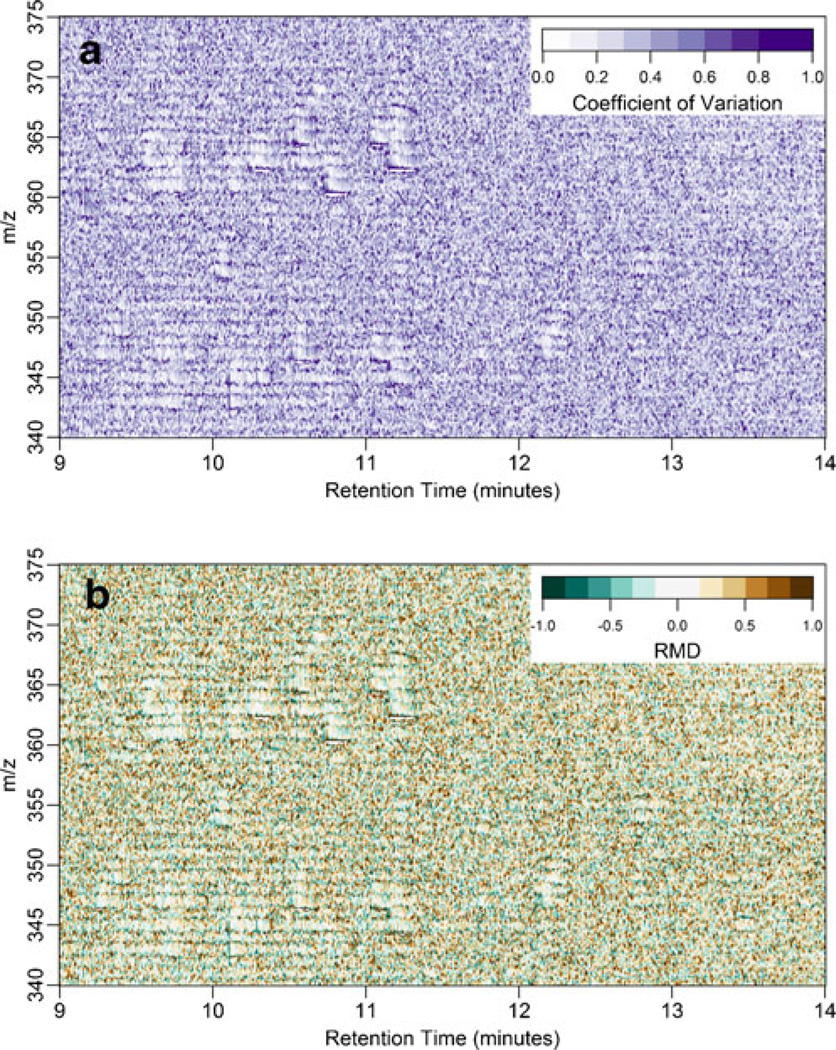
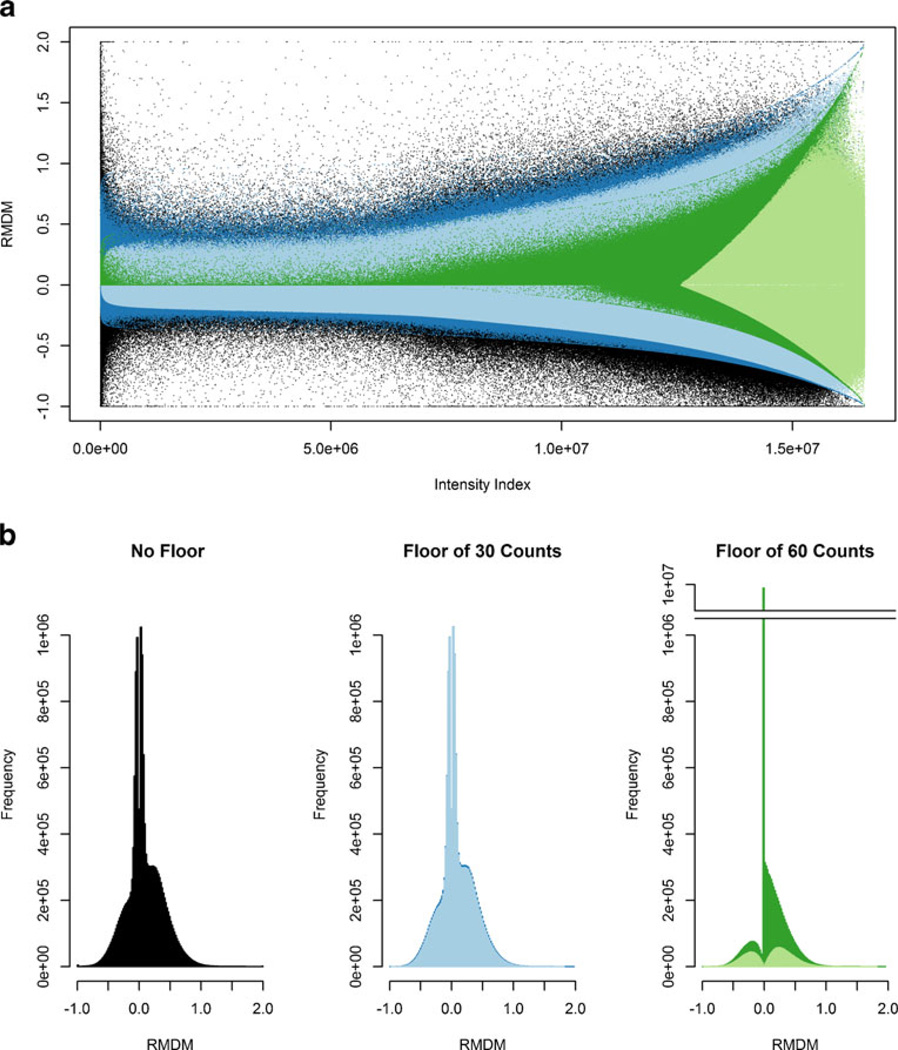
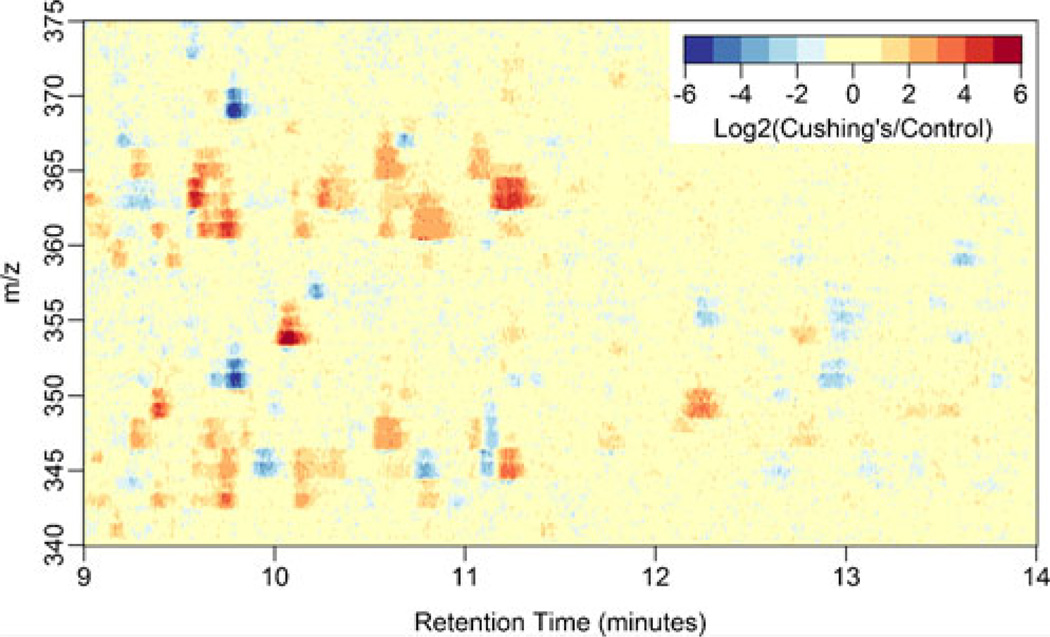
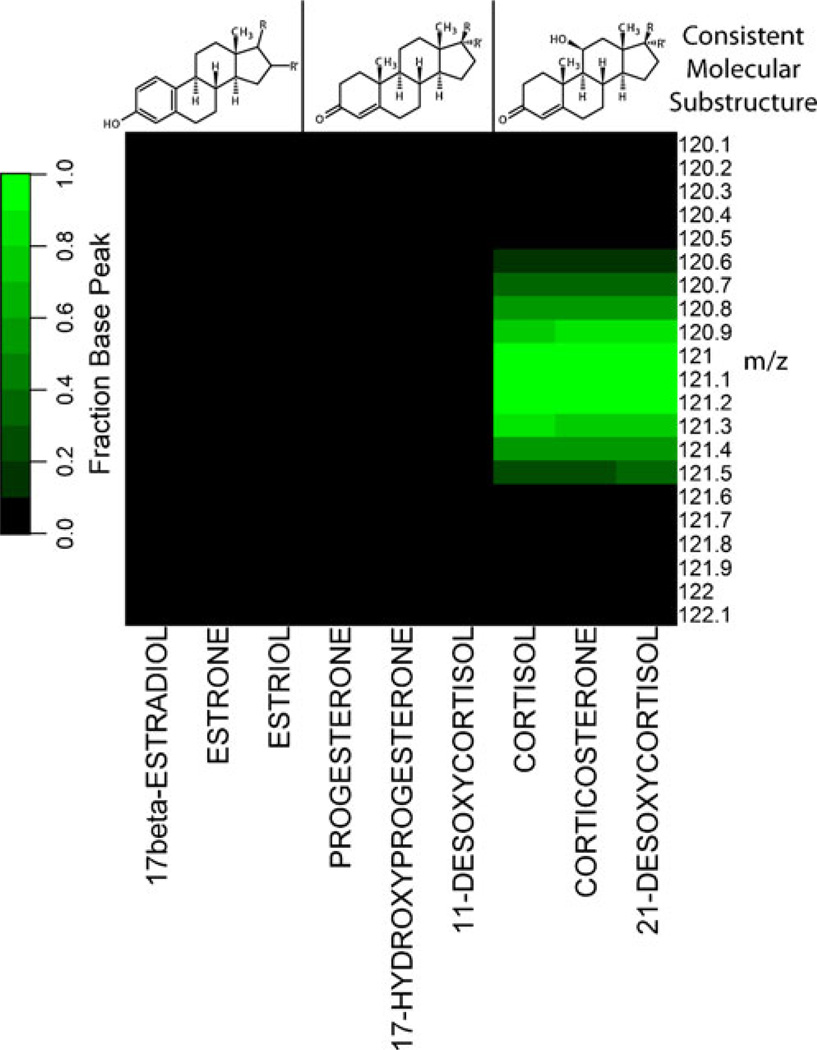
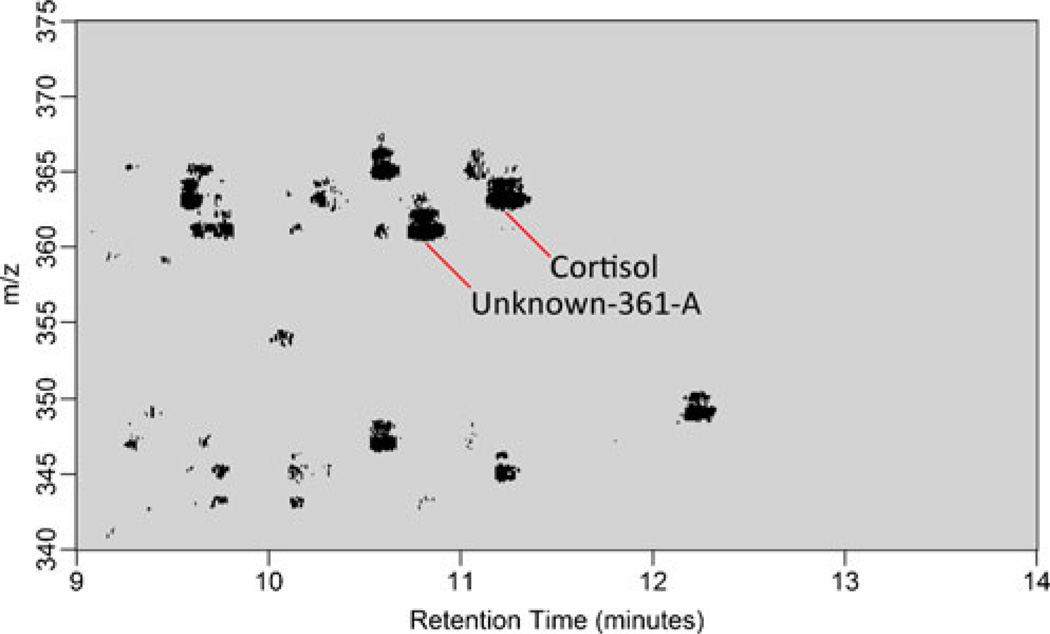
We have developed new applications of the pseudocolor plot for the analysis of LC/MS data. These applications include spectral averaging, analysis of variance, differential comparison of spectra, and qualitative filtering by compound class. These applications have been motivated by the need to better understand LC/MS data generated from analysis of human biofluids. The examples presented use data generated to profile steroid hormones in urine extracts from a Cushing's disease patient relative to a healthy control, but are general to any discovery-based scanning mass spectrometry technique. In addition to new visualization techniques, we introduce a new metric of variance: the relative maximum difference from the mean. We also introduce the concept of substructure-dependent analysis of steroid hormones using precursor ion scans. These new analytical techniques provide an alternative approach to traditional untargeted metabolomics workflow. We present an approach to discovery using MS that essentially eliminates alignment or preprocessing of spectra. Moreover, we demonstrate the concept that untargeted metabolomics can be achieved using low mass resolution instrumentation.
Figures
References
-
- Sugimoto M, Hirayama A, Ishikawa T, Robert M, Baran R, Uehara K, Kawai K, Soga T, Tomita M. Differential metabolomics software for capillary electrophoresis-mass spectrometry data analysis. Metabolomics. 2010;6:27–41.
-
- Grigsby CC, Rizki MM, Tamburino LA, Pitsch RL, Shiyanov PA, Cool DR. Metabolite Differentiation and Discovery Lab (MeDDL): A new tool for biomarker discovery and mass spectral visualization. Anal. Chem. 2010;82:4386–4395. - PubMed
Publication types
MeSH terms
Substances
Grants and funding
LinkOut - more resources
Full Text Sources
Other Literature Sources
Molecular Biology Databases
