

Quantitative interactions between the A-type K+ current and inositol trisphosphate receptors regulate intraneuronal Ca2+ waves and synaptic plasticity
- PMID: 23283761
- PMCID: PMC3624844
- DOI: 10.1113/jphysiol.2012.245688
Quantitative interactions between the A-type K+ current and inositol trisphosphate receptors regulate intraneuronal Ca2+ waves and synaptic plasticity
Abstract
The A-type potassium current has been implicated in the regulation of several physiological processes. Here, we explore a role for the A-type potassium current in regulating the release of calcium through inositol trisphosphate receptors (InsP3R) that reside on the endoplasmic reticulum (ER) of hippocampal pyramidal neurons. To do this, we constructed morphologically realistic, conductance-based models equipped with kinetic schemes that govern several calcium signalling modules and pathways, and constrained the distributions and properties of constitutive components by experimental measurements from these neurons. Employing these models, we establish a bell-shaped dependence of calcium release through InsP3Rs on the density of A-type potassium channels, during the propagation of an intraneuronal calcium wave initiated through established protocols. Exploring the sensitivities of calcium wave initiation and propagation to several underlying parameters, we found that ER calcium release critically depends on dendritic diameter and that wave initiation occurred at branch points as a consequence of a high surface area to volume ratio of oblique dendrites. Furthermore, analogous to the role of A-type potassium channels in regulating spike latency, we found that an increase in the density of A-type potassium channels led to increases in the latency and the temporal spread of a propagating calcium wave. Next, we incorporated kinetic models for the metabotropic glutamate receptor (mGluR) signalling components and a calcium-controlled plasticity rule into our model and demonstrate that the presence of mGluRs induced a leftward shift in a Bienenstock-Cooper-Munro-like synaptic plasticity profile. Finally, we show that the A-type potassium current could regulate the relative contribution of ER calcium to synaptic plasticity induced either through 900 pulses of various stimulus frequencies or through theta burst stimulation. Our results establish a novel form of interaction between active dendrites and the ER membrane, uncovering a powerful mechanism that could regulate biophysical/biochemical signal integration and steer the spatiotemporal spread of signalling microdomains through changes in dendritic excitability.
Figures
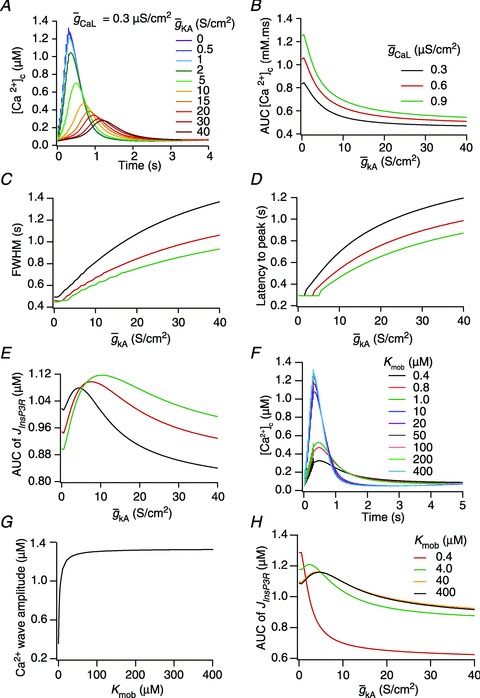
 (E), in achieving these transients, plotted as functions of A-conductance density,
  . Plots are shown for different densities of the L-type Ca2+ channel,
  . F and G, time-dependent [Ca2+]c changes (F) and the amplitude (G) of Ca2+ wave, computed in the presence of mobile buffers at different affinities (Kmob) to Ca2+ binding. Ca2+ wave was initiated with 100 μ
 plotted as functions of A-conductance density,
  , when the Ca2+ wave was initiated in the presence of 100 μ
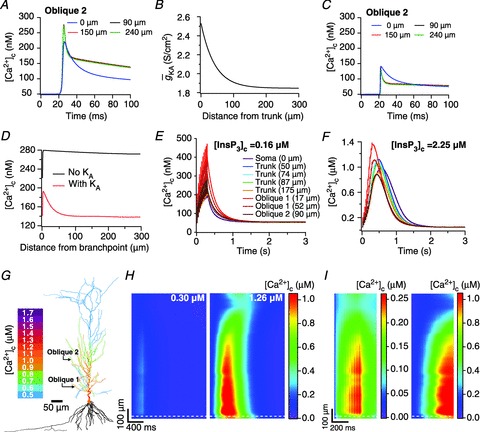
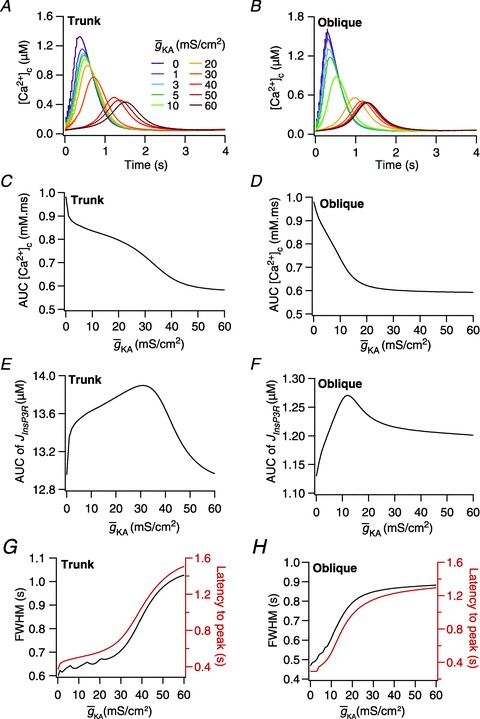
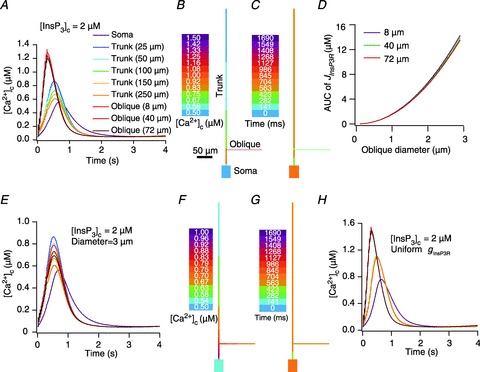
 ), at representative trunk (A) and proximal oblique (B) locations. C and D, area under the curve (AUC) for total [Ca2+]c plotted as a function of
  , at representative trunk (C) and proximal oblique (D) locations. E and F, AUC for the Ca2+ flux through InsP3 receptors (
 ) plotted as a function of
  , at representative trunk (E) and proximal oblique (F) locations. G and H, temporal aspects of the Ca2+ wave quantified as the wave's full-width at half-maximum (FWHM) and latency to peak, and plotted as functions of
  , at representative trunk (A) and proximal oblique (B) locations. Trunk: location on the apical trunk 77 μm (radial distance) from the soma; Oblique: location on Oblique 1 (Fig. 4G) 17 μm (path distance) away from the branch point on the trunk. For A–H
 represents the value of A-type K+ channel densities at the soma while the individual compartments had local
  according to eqn (3) along the neuronal topograph.
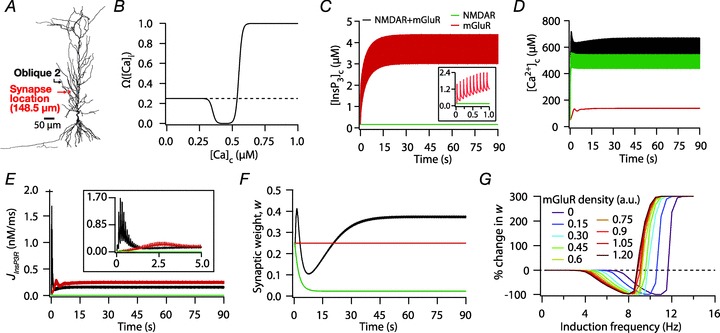
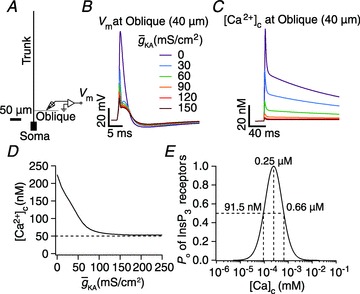
 (eqn (43)), plotted for various concentrations of [Ca2+]c. C–F, evolution of local [InsP3]c (C), local [Ca2+]c (D), local Ca2+ flux through InsP3 receptors,
  (E), and normalized synaptic weight, w (F), when a synapse was stimulated by 900 presynaptic action potentials at 10 Hz, shown for cases where the synapse contained only mGluRs or only NMDARs or both mGluRs and NMDARs. Note that the trace obtained in the presence of only mGluRs and the trace obtained in the presence of both mGluRs and NMDARs are overlapping in C. Insets in C and E show the same plots in C and E, expanded over the first 1 and 5 s of the induction protocol, respectively. G, synaptic plasticity profile across various induction frequencies (900 pulses), shown for various densities of mGluRs in the synaptic compartment.
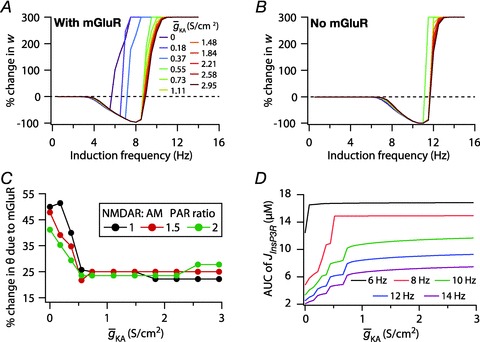
 ) in the synaptic compartment, in the presence (A, density = 1.2 a.u.) and the absence (B) of mGluR. C, percentage change in θ due to mGluR, calculated as 100 × (θmGluR – θnomGluR)/θnomGluR (obtained from experiments shown in A and B), plotted as a function of
  . The different plots correspond to simulations performed with different values for the NAR, to assess the relative contribution of NMDAR and mGluR to plasticity. D, area under the curve (AUC) of
  through the 900 pulses protocol plotted as a function of
  at various induction frequencies employed, for saturating mGluR density (= 1.2 × 10⁻³ a.u.) at 1.5 NAR. AMPAR densities remained the same across these simulations.
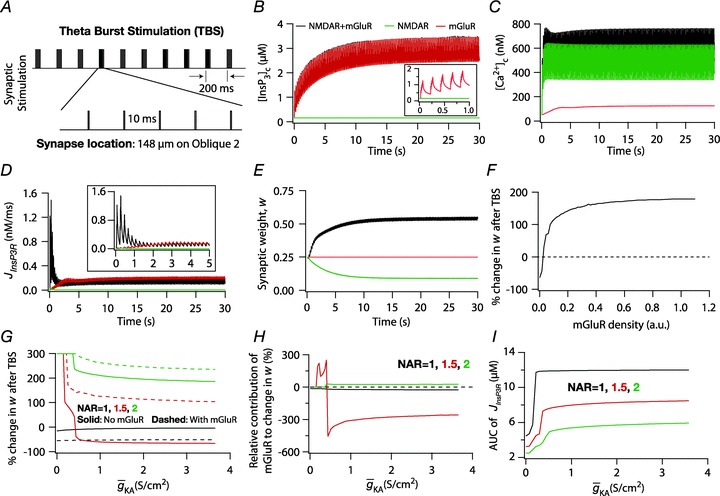
 (D), and normalized synaptic weight, w (E), when a synapse was stimulated by TBS, shown for cases where the synapse contained only mGluRs or only NMDARs or both mGluRs and NMDARs. Note that the trace obtained in the presence of only mGluRs and the trace obtained in the presence of both mGluRs and NMDARs are overlapping in B. Insets in B and D show the same plots in B and D, expanded over the first 1 and 5 s of the induction protocol, respectively. F, steady state change in synaptic weight after TBS, shown for various densities of mGluRs in the synaptic compartment. G, Steady-state change in synaptic weight after TBS, plotted as a function of the A-type K+ conductance density (
 ) for different values of NMDAR:AMPAR ratio (NAR), in the presence and absence of mGluRs. H, percentage change in synaptic weight due to mGluR, calculated as 100 × (Δ%wmGluR
– Δ%wnomGluR)/Δ%wnomGluR (obtained from experiments shown in G), plotted as a function of
) for different values of NMDAR:AMPAR ratio (NAR), in the presence and absence of mGluRs. H, percentage change in synaptic weight due to mGluR, calculated as 100 × (Δ%wmGluR
– Δ%wnomGluR)/Δ%wnomGluR (obtained from experiments shown in G), plotted as a function of  . The different plots correspond to simulations performed with different values for the NAR, to assess the relative contribution of NMDAR and mGluR to plasticity. I, area under the curve (AUC) of
  through the TBS protocol plotted as a function of
  , for various values of NAR at saturating concentration of mGluR (= 1.1 × 10⁻³ a.u.). AMPAR densities remained the same across these simulations.
References
-
- Abdul-Ghani MA, Valiante TA, Carlen PL, Pennefather PS. Metabotropic glutamate receptors coupled to IP3 production mediate inhibition of IAHP in rat dentate granule neurons. J Neurophysiol. 1996;76:2691–2700. - PubMed
-
- Adelman JP, Maylie J, Sah P. Small-conductance Ca2+-activated K+ channels: form and function. Annu Rev Physiol. 2012;74:245–269. - PubMed
-
- Allbritton NL, Meyer T, Stryer L. Range of messenger action of calcium ion and inositol 1,4,5-trisphosphate. Science. 1992;258:1812–1815. - PubMed
-
- Anwyl R. Metabotropic glutamate receptors: electrophysiological properties and role in plasticity. Brain Res Brain Res Rev. 1999;29:83–120. - PubMed
-
- Ascoli GA, Donohue DE, Halavi M. NeuroMorpho.Org: a central resource for neuronal morphologies. J Neurosci. 2007;27:9247–9251. - PMC - PubMed
Publication types
MeSH terms
Substances
LinkOut - more resources
Full Text Sources
Other Literature Sources
Molecular Biology Databases
Miscellaneous