

Detection of receptor-induced glycoprotein conformational changes on enveloped virions by using confocal micro-Raman spectroscopy
- PMID: 23283947
- PMCID: PMC3592171
- DOI: 10.1128/JVI.03220-12
Detection of receptor-induced glycoprotein conformational changes on enveloped virions by using confocal micro-Raman spectroscopy
Abstract
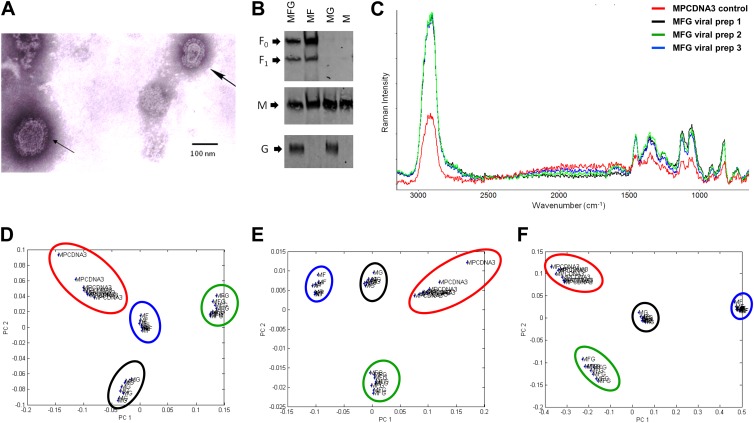
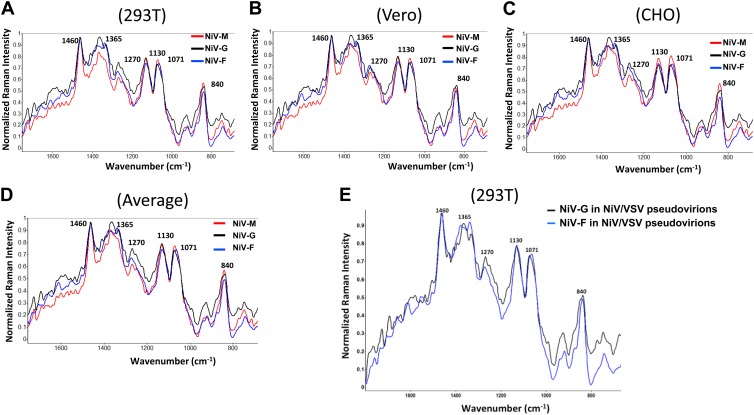
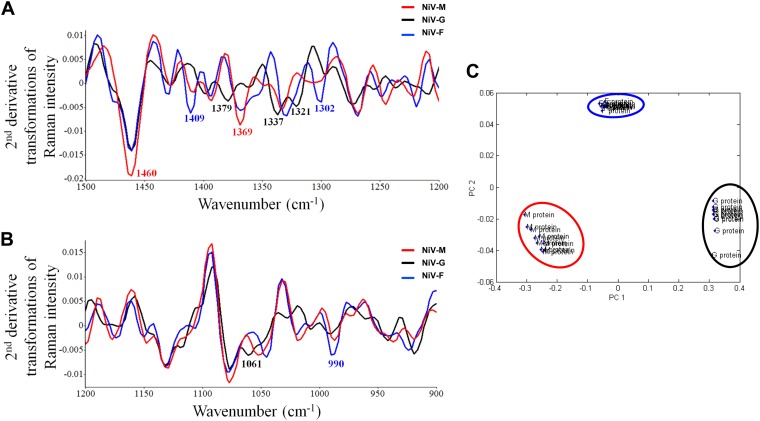
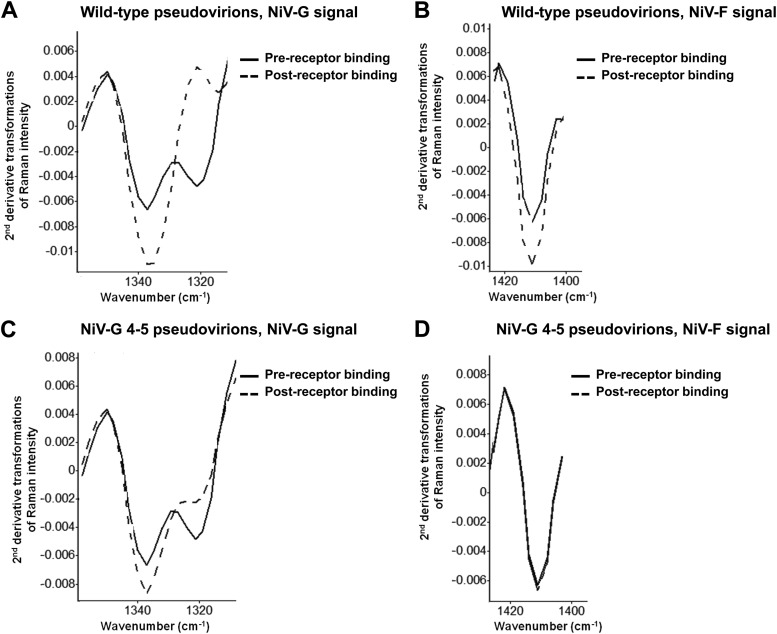
Conformational changes in the glycoproteins of enveloped viruses are critical for membrane fusion, which enables viral entry into cells and the pathological cell-cell fusion (syncytia) associated with some viral infections. However, technological capabilities for identifying viral glycoproteins and their conformational changes on actual enveloped virus surfaces are generally scarce, challenging, and time-consuming. Our model, Nipah virus (NiV), is a syncytium-forming biosafety level 4 pathogen with a high mortality rate (40 to 75%) in humans. Once the NiV attachment glycoprotein (G) (NiV-G) binds the cell receptor ephrinB2 or -B3, G triggers conformational changes in the fusion glycoprotein (F) that result in membrane fusion and viral entry. We demonstrate that confocal micro-Raman spectroscopy can, within minutes, simultaneously identify specific G and F glycoprotein signals and receptor-induced conformational changes in NiV-F on NiV virus-like particles (VLPs). First, we identified reproducible G- and F-specific Raman spectral features on NiV VLPs containing M (assembly matrix protein), G, and/or F or on NiV/vesicular stomatitis virus (VSV) pseudotyped virions via second-derivative transformations and principal component analysis (PCA). Statistical analyses validated our PCA models. Dynamic temperature-induced conformational changes in F and G or receptor-induced target membrane-dependent conformational changes in F were monitored in NiV pseudovirions in situ in real time by confocal micro-Raman spectroscopy. Advantageously, Raman spectroscopy can identify specific protein signals in relatively impure samples. Thus, this proof-of-principle technological development has implications for the rapid identification and biostability characterization of viruses in medical, veterinary, and food samples and for the analysis of virion glycoprotein conformational changes in situ during viral entry.
Figures
Similar articles
-
Nipah virus attachment glycoprotein stalk C-terminal region links receptor binding to fusion triggering.J Virol. 2015 Feb;89(3):1838-50. doi: 10.1128/JVI.02277-14. Epub 2014 Nov 26. J Virol. 2015. PMID: 25428863 Free PMC article.
-
Nipah virion entry kinetics, composition, and conformational changes determined by enzymatic virus-like particles and new flow virometry tools.J Virol. 2014 Dec;88(24):14197-206. doi: 10.1128/JVI.01632-14. Epub 2014 Oct 1. J Virol. 2014. PMID: 25275126 Free PMC article.
-
Multiple Strategies Reveal a Bidentate Interaction between the Nipah Virus Attachment and Fusion Glycoproteins.J Virol. 2016 Nov 14;90(23):10762-10773. doi: 10.1128/JVI.01469-16. Print 2016 Dec 1. J Virol. 2016. PMID: 27654290 Free PMC article.
-
Envelope-receptor interactions in Nipah virus pathobiology.Ann N Y Acad Sci. 2007 Apr;1102(1):51-65. doi: 10.1196/annals.1408.004. Ann N Y Acad Sci. 2007. PMID: 17470911 Free PMC article. Review.
-
Henipavirus mediated membrane fusion, virus entry and targeted therapeutics.Viruses. 2012 Feb;4(2):280-308. doi: 10.3390/v4020280. Epub 2012 Feb 13. Viruses. 2012. PMID: 22470837 Free PMC article. Review.
Cited by
-
Nipah virus attachment glycoprotein stalk C-terminal region links receptor binding to fusion triggering.J Virol. 2015 Feb;89(3):1838-50. doi: 10.1128/JVI.02277-14. Epub 2014 Nov 26. J Virol. 2015. PMID: 25428863 Free PMC article.
-
An in situ Raman spectroscopy-based microfluidic "lab-on-a-chip" platform for non-destructive and continuous characterization of Pseudomonas aeruginosa biofilms.Chem Commun (Camb). 2015 May 28;51(43):8966-9. doi: 10.1039/c5cc02744f. Chem Commun (Camb). 2015. PMID: 25929246 Free PMC article.
-
Investigating the responses of Cronobacter sakazakii to garlic-drived organosulfur compounds: a systematic study of pathogenic-bacterium injury by use of high-throughput whole-transcriptome sequencing and confocal micro-raman spectroscopy.Appl Environ Microbiol. 2014 Feb;80(3):959-71. doi: 10.1128/AEM.03460-13. Epub 2013 Nov 22. Appl Environ Microbiol. 2014. PMID: 24271174 Free PMC article.
-
Raman spectroscopy characterization of antibody phases in serum.MAbs. 2014;6(6):1509-17. doi: 10.4161/19420862.2014.975100. MAbs. 2014. PMID: 25484036 Free PMC article.
-
Determination of the denaturation temperature of the Spike protein S1 of SARS-CoV-2 (2019 nCoV) by Raman spectroscopy.Spectrochim Acta A Mol Biomol Spectrosc. 2022 Jan 5;264:120269. doi: 10.1016/j.saa.2021.120269. Epub 2021 Aug 12. Spectrochim Acta A Mol Biomol Spectrosc. 2022. PMID: 34418811 Free PMC article.
References
-
- Tran EEH, Borgnia MJ, Kuybeda O, Schauder DM, Bartesaghi A, Frank GA, Sapiro G, Milne JLS, Subramaniam S. 2012. Structural mechanism of trimeric HIV-1 envelope glycoprotein activation. PLoS Pathog. 8:e1002797 doi:10.1371/journal.ppat.1002797 - DOI - PMC - PubMed
Publication types
MeSH terms
Substances
Grants and funding
LinkOut - more resources
Full Text Sources
Other Literature Sources
