. 2013 Mar;87(6):3217-28.
doi: 10.1128/JVI.02984-12. Epub 2013 Jan 2.

Neuroattenuation of vesicular stomatitis virus through picornaviral internal ribosome entry sites

Affiliations

Neuroattenuation of vesicular stomatitis virus through picornaviral internal ribosome entry sites

Arun Ammayappan et al. J Virol. 2013 Mar.

Abstract

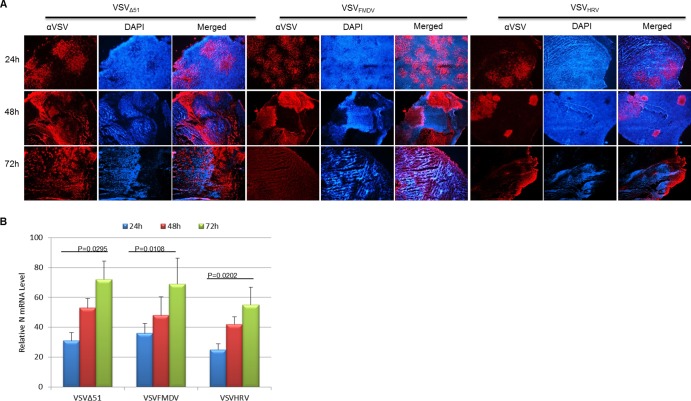
Vesicular stomatitis virus (VSV) is potent and a highly promising agent for the treatment of cancer. However, translation of VSV oncolytic virotherapy into the clinic is being hindered by its inherent neurotoxicity. It has been demonstrated that selected picornaviral internal ribosome entry site (IRES) elements possess restricted activity in neuronal tissues. We therefore sought to determine whether the picornavirus IRES could be engineered into VSV to attenuate its neuropathogenicity. We have used IRES elements from human rhinovirus type 2 (HRV2) and foot-and-mouth disease virus (FMDV) to control the translation of the matrix gene (M), which plays a major role in VSV virulence. In vitro studies revealed slowed growth kinetics of IRES-controlled VSVs in most of the cell lines tested. However, in vivo studies explicitly demonstrated that IRES elements of HRV2 and FMDV severely attenuated the neurovirulence of VSV without perturbing its oncolytic potency.


Figures

Fig 1
Fig 1
Construction and recovery of pVSVIRES. (A) The circular map shows the structure of plasmid pVSV-MC11-eGFP with artificially inserted unique restriction sites. (B) A schematic representation of VSV genome constructs with IRES elements. The short hairpin is shown before the IRES at the 5′ end. M* indicates a matrix gene mutation (M51 deletion). (C) VSV genome constructs with FMDV and HRV IRES elements. The gene junction is shown in the middle. The pVSVFMDV and pVSVHRV plasmids were made by insertion of FMDV IRES and HRV IRES elements, respectively, before the start codon of the M gene (boxed). The hairpin is also shown (Hp). Capital bold letters are VSV P and M stop and start codons, respectively. The SmaI restriction site is shown in italics and underlined. The nucleotides (40 nt) between P and M ORF are shown as dotted lines (P/M UTR), and the last five nucleotides of the P/M gene junction are also shown (TGTTA). (D) The circular map shows the structure of plasmid pCI-eGFP, in which the eGFP ORF was inserted between NheI and NotI restriction sites. It was driven by the CMV promoter. A short hairpin (Hp) was inserted before the eGFP start codon. (E) Fluorescence microscopic images of BHK cells transfected with equal amounts of pCI-eGFP plasmid with or without hairpin.
Fig 2
Fig 2
Analysis of growth properties of VSV carrying IRES elements. (A and B) Single-step (A) and multistep (B) growth curve analysis of the indicated viruses. (C) Phase-contrast microscopic images of BHK cells infected with VSVwt, VSVΔ51, VSVFMDV, and VSVHRV (24 h p.i. with an MOI of 0.01). Arrows indicate typical CPE produced by IRES viruses. (D) Relative expression of N and M genes from three replicates (16 h p.i. with an MOI of 1.0). Initially the VSV RNA levels were normalized to GAPDH RNA. The M/N mRNA ratio was determined and normalized to the VSVwt M/N mRNA ratio and expressed as the mean percentage relative to VSVwt. Error bars represent the standard error of the mean. Where error bars are not visible, the standard error was negligible.
Fig 3
Fig 3
Analysis of viral growth kinetics. (A) Multistep growth curve. Replication of VSVwt, VSVΔ51, VSVFMDV, and VSVHRV in BHK cells at an MOI of 0.01 is shown. Supernatants were collected from infected cells at the indicated time points, and virus titers were calculated by standard TCID50 assay. Cell lysates were harvested and analyzed for the virus-specific proteins by Western blotting. (B) Single-step growth curve. Replication of VSVwt, VSVΔ51, VSVFMDV, and VSVHRV in BHK cells at an MOI of 10.0 is shown. Supernatants were collected from infected cells at the indicated time points, and virus titers were calculated by standard TCID50 assay. Cell lysates were harvested and analyzed for the VSV-specific proteins by Western blotting.
Fig 4
Fig 4
Growth properties of IRES-controlled viruses in various cancer cell lines. (A) After 12 h p.i. (MOI, 10.0), viral titers were determined by standard TCID50 assay. Average titers and standard deviations (SDs) (error bars) for the three replicates are shown. (B) Cell lysates were harvested after 12 h p.i. and analyzed for the virus-specific proteins by Western blotting. (C) Initially, densitometry was performed using ImageJ software for the blots shown in panel B. The M/N-P protein ratio was determined, normalized to the VSVwt M/N-P protein ratio, and expressed as the percentage relative to VSVwt.
Fig 5
Fig 5
Growth properties of rVSVs in primary human neuronal cell. (A) Phase-contrast and fluorescence microscopic images of primary human cortical neuronal cells (HCN-2) infected with VSVwt, VSVΔ51, VSVFMDV, and VSVHRV (48 h p.i. with an MOI of 10.0). (B) Cell lysates were harvested and analyzed for the virus-specific proteins by Western blotting. (C) Supernatants were collected from infected cells after 48 h p.i., and virus titers were calculated by standard TCID50 assay. Average titers and SDs (error bars) for the three replicates are shown.
Fig 6
Fig 6
Determination of immune evasion properties of IRES-controlled viruses. After treatment with various concentrations of IFN-α for 24 h, VSV replication and viral protein expression levels were examined. (A) Replication of VSVs was determined by fluorescence microscopy. (B) GFP-expressing cells from the panel A were quantified using ImageJ software (means of three areas are shown). (C) Viral titers were determined by standard TCID50 assay. Average titers and SDs (error bars) for the three replicates are shown.
Fig 7
Fig 7
Attenuation of VSV neurovirulence by IRES elements. (A and B) Kaplan-Meier survival graphs for mice (BALB/c, 4 weeks old) inoculated intracranially with 1 × 10⁴ TCID50s (A) and 1 × 10⁶ to 108 TCID50s (B) of rVSV particles and monitored for signs of neurotoxicity. (C) VSV-injected (intracranially) mouse brain was harvested at 48 h p.i., frozen in OCT, and sectioned, and immunofluorescence staining was performed to detect VSV (red) and nuclei (blue). (D) Relative expression of the N gene in the indicated mouse brain by real-time PCR analysis. The data are the N gene level normalized to the GAPDH RNA level relative to that in brain tissue and are represented as mean ± SDs (n = 3).
Fig 8
Fig 8
Oncolytic efficacy of IRES-controlled viruses. (A to D) Mice (BALB/c, 4 weeks old) bearing subcutaneous MPC-11 tumors were treated with a single intravenous dose (1 × 10⁸) of Opti-MEM (A), VSVΔ51 (B), VSVFMDV (C), or (D) VSVHRV. Tumor size was measured by serial caliper measurements. (E) Kaplan-Meier survival curves for the mice from panels A through D. *, P = 0.0009 versus Opti-MEM; **, P = 0.0052 versus Opti-MEM; Δ, P = 0.2263 versus VSVFMDV, P = 0.0466 versus VSVHRV, and P = 0.1883 VSVFMDV versus VSVHRV. (F) Mouse body weight analysis. The average body weight per group throughout the experiment is plotted as the mean ± SD. ‡, no mouse was left after this point.
Fig 9
Fig 9
Analysis of virus spread in myeloma tumors in vivo. (A) MPC-11 tumor-bearing mice were injected with a single intravenous dose (108 TCID50s) of the indicated viruses. Tumors were harvested and sectioned at 24, 48, and 72 h posttreatment and immunohistochemistry (IHC) carried out to detect VSV antigen (red) and cell nuclei (Hoechst/blue). Magnification, ×40. (B) Relative expression of the N gene in the indicated mouse tumor by real-time PCR analysis. The data are the N gene level normalized to the GAPDH RNA level relative to that in tumor tissue and are represented by the mean ± SD (n = 3).

Similar articles

Cited by

References

    1. Alajez NM, Mocanu JD, Shi W, Chia MC, Breitbach CJ, Hui AB, Knowles S, Bell JC, Busson P, Takada K, Lo KW, O'Sullivan B, Gullane P, Liu FF. 2008. Efficacy of systemically administered mutant vesicular stomatitis virus (VSVDelta51) combined with radiation for nasopharyngeal carcinoma. Clin. Cancer Res. 14:4891–4897 - PubMed
    1. Naik S, Nace R, Federspiel MJ, Barber GN, Peng KW, Russell SJ. 2012. Curative one-shot systemic virotherapy in murine myeloma. Leukemia 26:1870–1878 - PMC - PubMed
    1. Shinozaki K, Ebert O, Woo SL. 2005. Treatment of multi-focal colorectal carcinoma metastatic to the liver of immune-competent and syngeneic rats by hepatic artery infusion of oncolytic vesicular stomatitis virus. Int. J. Cancer 114:659–664 - PubMed
    1. Stojdl DF, Lichty B, Knowles S, Marius R, Atkins H, Sonenberg N, Bell JC. 2000. Exploiting tumor-specific defects in the interferon pathway with a previously unknown oncolytic virus. Nat. Med. 6:821–825 - PubMed
    1. Willmon CL, Saloura V, Fridlender ZG, Wongthida P, Diaz RM, Thompson J, Kottke T, Federspiel M, Barber G, Albelda SM, Vile RG. 2009. Expression of IFN-beta enhances both efficacy and safety of oncolytic vesicular stomatitis virus for therapy of mesothelioma. Cancer Res. 69:7713–7720 - PMC - PubMed

MeSH terms

Substances