. 2012;8(12):e1003080.
doi: 10.1371/journal.pgen.1003080. Epub 2012 Dec 20.

Population Genomics of sub-saharan Drosophila melanogaster: African diversity and non-African admixture

Affiliations

Population Genomics of sub-saharan Drosophila melanogaster: African diversity and non-African admixture

John E Pool et al. PLoS Genet. 2012.

Abstract

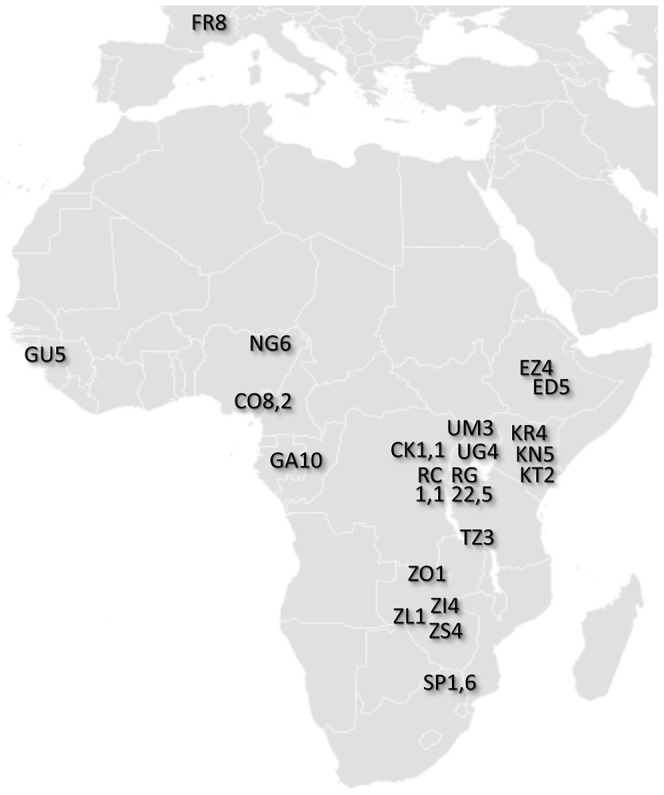
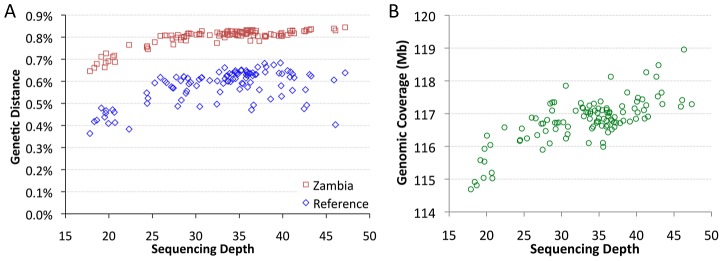
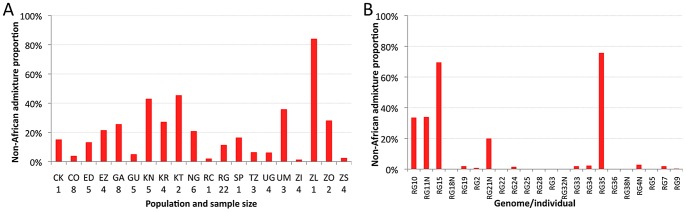
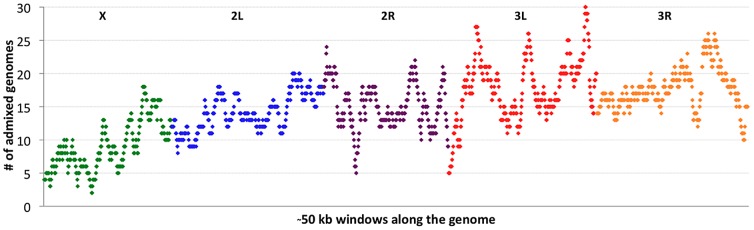
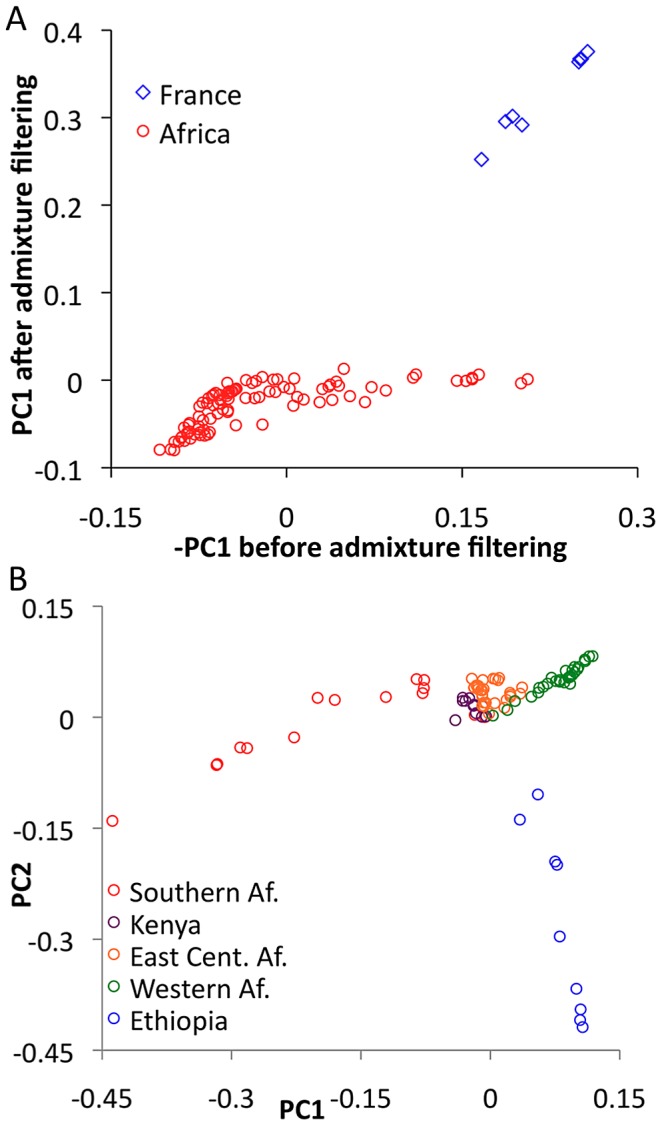
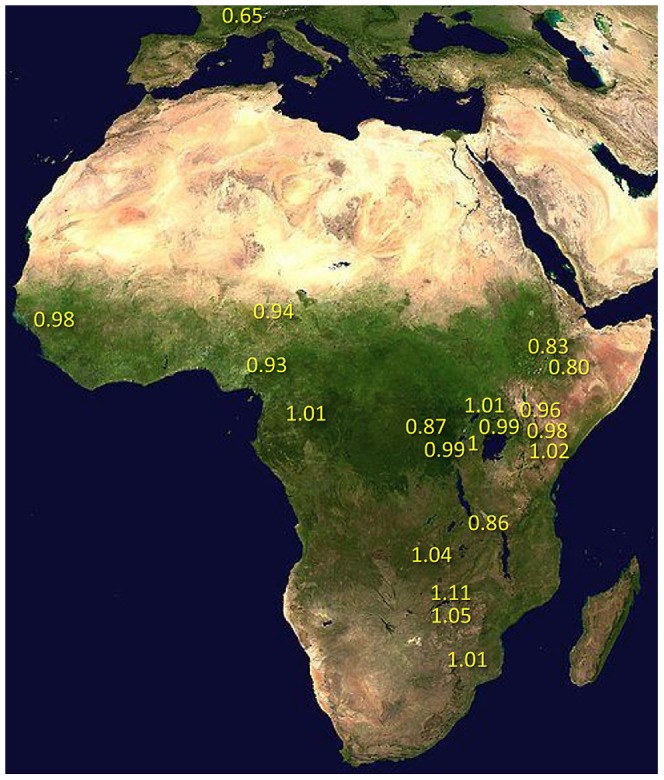
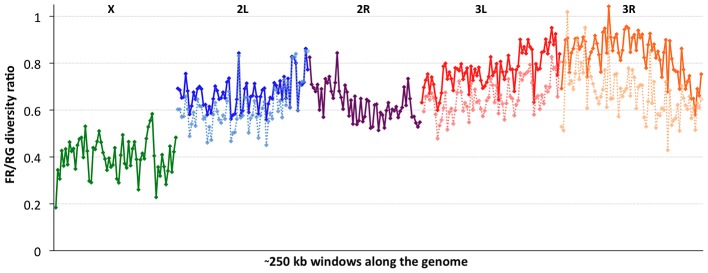
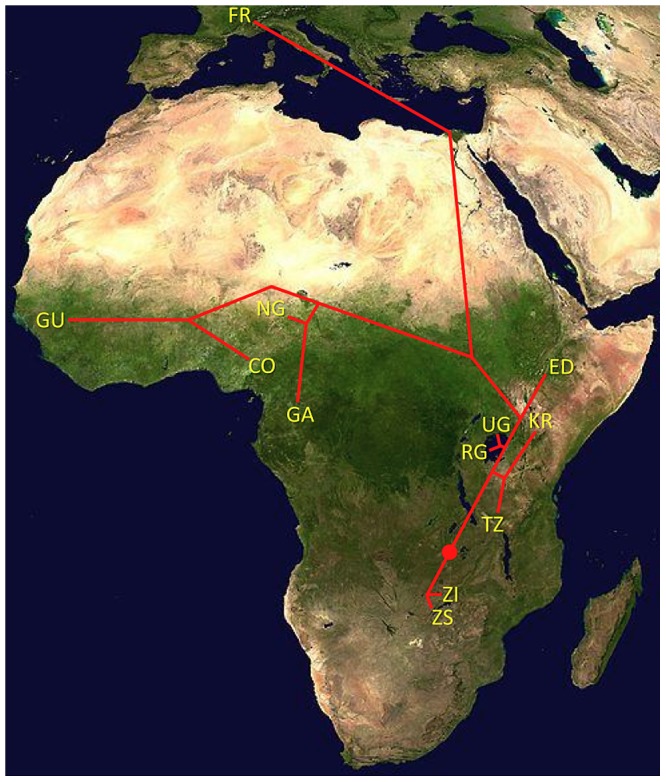
Drosophila melanogaster has played a pivotal role in the development of modern population genetics. However, many basic questions regarding the demographic and adaptive history of this species remain unresolved. We report the genome sequencing of 139 wild-derived strains of D. melanogaster, representing 22 population samples from the sub-Saharan ancestral range of this species, along with one European population. Most genomes were sequenced above 25X depth from haploid embryos. Results indicated a pervasive influence of non-African admixture in many African populations, motivating the development and application of a novel admixture detection method. Admixture proportions varied among populations, with greater admixture in urban locations. Admixture levels also varied across the genome, with localized peaks and valleys suggestive of a non-neutral introgression process. Genomes from the same location differed starkly in ancestry, suggesting that isolation mechanisms may exist within African populations. After removing putatively admixed genomic segments, the greatest genetic diversity was observed in southern Africa (e.g. Zambia), while diversity in other populations was largely consistent with a geographic expansion from this potentially ancestral region. The European population showed different levels of diversity reduction on each chromosome arm, and some African populations displayed chromosome arm-specific diversity reductions. Inversions in the European sample were associated with strong elevations in diversity across chromosome arms. Genomic scans were conducted to identify loci that may represent targets of positive selection within an African population, between African populations, and between European and African populations. A disproportionate number of candidate selective sweep regions were located near genes with varied roles in gene regulation. Outliers for Europe-Africa F(ST) were found to be enriched in genomic regions of locally elevated cosmopolitan admixture, possibly reflecting a role for some of these loci in driving the introgression of non-African alleles into African populations.


Conflict of interest statement

The authors have declared that no competing interests exist.

Figures

Figure 1
Figure 1. Locations of population samples from which the analyzed genomes were derived.
Each population sample is indicated by a two letter abbreviation followed by the number of primary core genomes sequenced. For populations with secondary core genomes, that number follows a comma. Additional data and sample characteristics are described in Table S1.
Figure 2
Figure 2. Mean sequencing depth.
Mean sequencing depth is correlated with genetic distance (A) and genomic coverage (B). African core genomes with data from all major chromosome arms are depicted. The effect of depth on genetic distance applies whether genomes are compared to the published reference genome (blue) or the Zambia ZI population sample (red). Subsequent analyses focused largely on “primary core” genomes with >25X depth.
Figure 3
Figure 3. Heterogeneity in estimated cosmopolitan admixture proportions.
Heterogeneity in estimated cosmopolitan admixture proportions, both among African populations (A) and within the Rwanda RG population sample (B).
Figure 4
Figure 4. Cosmopolitan admixture levels are depicted across the genome.
For each genomic window, the number of African primary core genomes (across all populations) with >50% admixture probability is plotted. Chromosome arms are labeled and indicated by color. Each window contains 1000 RG non-singleton SNPs (approximately 50 kb on average).
Figure 5
Figure 5. Principal Components Analysis (PCA).
(A) PCA was done for the full primary core data set before and after masking putative cosmopolitan admixture from sub-Saharan genomes. Reductions in the magnitude of PC1 after filtering are consistent with the admixture identification method being largely successful. (B) PCA was applied to the sub-Saharan genomes only, after admixture filtering. Genomes were found to cluster by geographical region, including southern (SP, TZ, ZI, ZL, ZO, ZS), eastern (CK, RC, RG, UG, UM), and western (CO, GA, GU, NG) African groups.
Figure 6
Figure 6. Relative nucleotide diversity, scaled by πRG, was calculated for each population sample.
This method allowed the comparison of diversity between populations with missing data in different genomic regions, and allowed the inclusion of secondary core genomes. Values were corrected for the modest predicted effects of sequencing depth (see Materials and Methods), and were based on non-centromeric, non-telomeric chromosomal regions, and equal weighting of chromosome arms.
Figure 7
Figure 7. The ratio of nucleotide diversity between non-African (France, FR) and African (Rwanda, RG) genomes.
Each window contains 5000 RG non-singleton SNPs. Chromosome arms are labeled and indicated by color. Dashed series for the three arms with segregating inversions in the FR sample reflect diversity ratios for standard chromosomes only, indicating that inversions add significant diversity at the scale of whole chromosome arms.
Figure 8
Figure 8. Topology of a neighbor-joining population distance tree based on the matrix of Dxy values (Table 2).
Red dot indicates root based on midpoint rooting. Branch lengths are not to scale.
Figure 9
Figure 9. Nucleotide diversity versus recombination rate for short intron sites (bp 8–30 in <65 bp introns) is plotted by cytological band.
Recombination rate estimates are from Langley et al. (2011), multiplied by one half for autosomes and two thirds for the X chromosome, and weighted by cytological sub-band recombination rate estimates and site counts.
Figure 10
Figure 10. Allele frequencies for the RG sample (using a sample size of 18) at short intron sites.
(A) The folded frequency spectrum for each chromosome arm. (B) Comparison of the proportion of SNPs with a minor allele count of 1 in regions of lower versus higher recombination.
Figure 11
Figure 11. Linkage disequilibrium (LD), excluding singleton polymorphisms.
Series refer to the observed LD for each major chromosome arm, and the expected LD from neutral equilibrium simulations for X-linked and autosomal loci, as given in panel A. (A) Average r2 for a series of SNP pair distance bins. (B) Average rω for SNP pairs with positive LD. (C) Average rω for SNP pairs with negative LD.

References

    1. Adams MD, Celniker SE, Holt RA, Evans CA, Gocayne JD, et al. (2000) The genome sequence of Drosophila melanogaster . Science 287: 2185–2195. - PubMed
    1. Roy S, Ernst J, Kharchenko PV, Kheradpour P, Negre N, et al. (2010) Identification of functional elements and regulatory circuits by Drosophila modENCODE. Science 330: 1787–1797. - PMC - PubMed
    1. Dobzhansky T, Sturtevant AH (1938) Inversions in the Chromosomes of Drosophila pseudoobscura . Genetics 23: 28–64. - PMC - PubMed
    1. Lewontin RC, Hubby JL (1966) A molecular approach to the study of genic heterozygosity in natural populations. II. Amount of variation and degree of heterozygosity in natural populations of Drosophila pseudoobscura . Genetics 54: 595–609. - PMC - PubMed
    1. Singh RS, Hickey DA, David J (1982) Genetic differentiation between geographically distant populations of Drosophila melanogaster . Genetics 101: 235–256. - PMC - PubMed

Publication types