. 2012;8(12):e1003125.
doi: 10.1371/journal.pgen.1003125. Epub 2012 Dec 20.

A new isolation with migration model along complete genomes infers very different divergence processes among closely related great ape species

Affiliations

A new isolation with migration model along complete genomes infers very different divergence processes among closely related great ape species

Thomas Mailund et al. PLoS Genet. 2012.

Abstract

We present a hidden Markov model (HMM) for inferring gradual isolation between two populations during speciation, modelled as a time interval with restricted gene flow. The HMM describes the history of adjacent nucleotides in two genomic sequences, such that the nucleotides can be separated by recombination, can migrate between populations, or can coalesce at variable time points, all dependent on the parameters of the model, which are the effective population sizes, splitting times, recombination rate, and migration rate. We show by extensive simulations that the HMM can accurately infer all parameters except the recombination rate, which is biased downwards. Inference is robust to variation in the mutation rate and the recombination rate over the sequence and also robust to unknown phase of genomes unless they are very closely related. We provide a test for whether divergence is gradual or instantaneous, and we apply the model to three key divergence processes in great apes: (a) the bonobo and common chimpanzee, (b) the eastern and western gorilla, and (c) the Sumatran and Bornean orang-utan. We find that the bonobo and chimpanzee appear to have undergone a clear split, whereas the divergence processes of the gorilla and orang-utan species occurred over several hundred thousands years with gene flow stopping quite recently. We also apply the model to the Homo/Pan speciation event and find that the most likely scenario involves an extended period of gene flow during speciation.


Conflict of interest statement

The authors have declared that no competing interests exist.

Figures

Figure 1
Figure 1. Isolation-with-migration model.
Our isolation-with-migration model considers two separated populations (sub-species or species) derived from a shared ancestral population in the recent past. The model assumes that the ancestral population split into two populations in the past, at time formula image, and that these two populations exchanged genes with migration rate formula image until a later time, formula image, where gene flow stopped. The coalescence process in this model is parameterized with a coalescence rate (inverse of the effective population size), formula image, and a recombination rate, formula image. The model is translated into a finite-state hidden Markov model by discretizing time into time intervals with break points formula image.
Figure 2
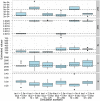
Figure 2. Estimation accuracy.
The box-plot shows the distribution of parameter estimates for six different simulation scenarios. In all scenarios the coalescence rate and the recombination rate parameters are kept fixed, while the end of gene flow, formula image, the initial population split, formula image, and the migration rate, formula image, varies between scenarios. For each simulation scenario, 10 independent data sets were generated and analyzed. The dashed horizontal lines indicate the simulated values for the five parameters. The recombination rate is consistently under-estimated while the remaining parameters are well recovered.
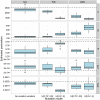
Figure 3
Figure 3. The effect of mutation rate variation.
The figure shows the effect on parameter estimation when the mutation rate is varied along the genome alignment. We split the alignment into segments geometrically distributed with mean length 500 bp and 2 kbp, and the mutation rate is then scaled by a random value chosen uniformly in the range 0.75 to 1.25 or 0.5 to 1.5. The dashed lines show the simulated values. The largest effect on varying the mutation rate is seen in the top-most parameters, the coalescence rate and the mutation rate. Varying the mutation rate increases the variance in coalescence times scaled with mutation rate, which is interpreted by the model as a decreased coalescence rate, while segments with low mutation rates are seen as more recent coalescence rates which the model interprets as evidence for migration. Consequently, variation in mutation rate decreases our estimates of the coalescence rate and increases our estimates of migration rates.
Figure 4
Figure 4. The effect of recombination rate variation.
The figure shows the effect on parameter estimation when the recombination rate is varied along the genome alignment. To simulate variation in the recombination rate, we sampled random 10 Mbp segments of the human genome, extracted the DeCODE recombination map for these segments, and scaled the recombination rate in the simulations according to the variation in this map. The dashed lines show the simulated values of the parameters. For most parameters, the effect of varying the recombination rate is seen as an increased variance in the estimates, while they do not appear to be biased. The exception is the recombination rate that becomes even more underestimated than for a constant recombination rate.
Figure 5
Figure 5. The effect of using a random genotype phase.
We simulated the situation where the genotype phase is unknown by simulating two genomes and selecting a random allele for all heterozygotic sites. The plot shows the effect on parameter estimates of not knowing the phase.
Figure 6
Figure 6. Split times estimates for the three great ape genera.
The box plot shows the estimated split times using either the isolation model or the isolation-with-migration model for the three great ape comparisons. The box plots on the left shows the split time estimate in the isolation model while the box plots on the right shows both the initial population divergence and the end of gene flow. The variation in estimates is from each 10 Mbp segment of the genome.
Figure 7
Figure 7. Chromosome wise split time estimates.
The box plots show the estimates of the initial split time and the end of gene flow in the isolation-with-migration model for each 10 Mbp segment for each chromosome.
Figure 8
Figure 8. Model comparison between the isolation and the isolation-with-migration model.
The box plots show the Akaike Information Criteria (AIC) for the isolation model against the isolation-with-migration model. For each 10 Mbp genomic segment we have plotted the AIC for the model including migration minus the model without. The model with the smallest AIC should be preferred, so values below zero prefers the isolation model while values above zero prefers the migration model.
Figure 9
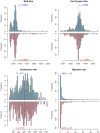
Figure 9. Parameter estimates for the human/chimpanzee split with the isolation model.
The histograms show the distribution of parameter estimates for the human/bonobo speciation (blue) and the human/chimpanzee speciation (red) using the isolation model.
Figure 10
Figure 10. Parameter estimates for the human/chimpanzee split with the isolation-with-migration model.
The histograms show the distribution of parameter estimates for the human/bonobo speciation (blue) and the human/chimpanzee speciation (red) using the isolation-with-migration model.
Figure 11
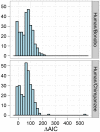
Figure 11. Model comparison for the human/chimpanzee and the human/bonobo split.
The histograms show the distribution of AIC differences for the isolation and isolation-with-migration model for the human/chimpanzee comparison and the human/bonobo comparison. Negative values indicate a preference for the isolation model while positive values indicate a preference for the isolation-with-migration model. The overall result points toward a preference for a prolonged speciation for the Homo/Pan split.
Figure 12
Figure 12. Split times scaled in years.
The figure shows the inferred split times when scaled with a mutation rate, formula image, ranging from formula image to formula image. The solid lines show mean estimates while the dashed lines the 95% confidence interval (formula imageSEM). The Homo/Pan slit is annotated with key fossils, the chimpanzee/bonobo split with the formation of the Congo River, and the orang-utan split with glacial period where sea level was low and migration between orang-utans possible.
Figure 13
Figure 13. Ancestral recombination graph and state space.
On the left is shown an ancestral recombination graph for two genomes with two nucleotides. Lineages, in the notation we use for constructing the CTMCs, are shown in red. On the right is shown the corresponding list of transitions int he CTMC with the type of transitions on the arrows: recombination (R), migration (M) and coalescence (C). The transition from the two separate populations to the ancestral population is a special transition – the projection matrix in the CTMC – shown in red.

Similar articles

  • Genomic relationships and speciation times of human, chimpanzee, and gorilla inferred from a coalescent hidden Markov model.
    Hobolth A, Christensen OF, Mailund T, Schierup MH. Hobolth A, et al. PLoS Genet. 2007 Feb 23;3(2):e7. doi: 10.1371/journal.pgen.0030007. Epub 2006 Nov 30. PLoS Genet. 2007. PMID: 17319744 Free PMC article.
  • Comparative and demographic analysis of orang-utan genomes.
    Locke DP, Hillier LW, Warren WC, Worley KC, Nazareth LV, Muzny DM, Yang SP, Wang Z, Chinwalla AT, Minx P, Mitreva M, Cook L, Delehaunty KD, Fronick C, Schmidt H, Fulton LA, Fulton RS, Nelson JO, Magrini V, Pohl C, Graves TA, Markovic C, Cree A, Dinh HH, Hume J, Kovar CL, Fowler GR, Lunter G, Meader S, Heger A, Ponting CP, Marques-Bonet T, Alkan C, Chen L, Cheng Z, Kidd JM, Eichler EE, White S, Searle S, Vilella AJ, Chen Y, Flicek P, Ma J, Raney B, Suh B, Burhans R, Herrero J, Haussler D, Faria R, Fernando O, Darré F, Farré D, Gazave E, Oliva M, Navarro A, Roberto R, Capozzi O, Archidiacono N, Della Valle G, Purgato S, Rocchi M, Konkel MK, Walker JA, Ullmer B, Batzer MA, Smit AF, Hubley R, Casola C, Schrider DR, Hahn MW, Quesada V, Puente XS, Ordoñez GR, López-Otín C, Vinar T, Brejova B, Ratan A, Harris RS, Miller W, Kosiol C, Lawson HA, Taliwal V, Martins AL, Siepel A, Roychoudhury A, Ma X, Degenhardt J, Bustamante CD, Gutenkunst RN, Mailund T, Dutheil JY, Hobolth A, Schierup MH, Ryder OA, Yoshinaga Y, de Jong PJ, Weinstock GM, Rogers J, Mardis ER, Gibbs RA, Wilson RK. Locke DP, et al. Nature. 2011 Jan 27;469(7331):529-33. doi: 10.1038/nature09687. Nature. 2011. PMID: 21270892 Free PMC article.
  • Incomplete lineage sorting patterns among human, chimpanzee, and orangutan suggest recent orangutan speciation and widespread selection.
    Hobolth A, Dutheil JY, Hawks J, Schierup MH, Mailund T. Hobolth A, et al. Genome Res. 2011 Mar;21(3):349-56. doi: 10.1101/gr.114751.110. Epub 2011 Jan 26. Genome Res. 2011. PMID: 21270173 Free PMC article.
  • Evolution and demography of the great apes.
    Kuhlwilm M, de Manuel M, Nater A, Greminger MP, Krützen M, Marques-Bonet T. Kuhlwilm M, et al. Curr Opin Genet Dev. 2016 Dec;41:124-129. doi: 10.1016/j.gde.2016.09.005. Epub 2016 Oct 4. Curr Opin Genet Dev. 2016. PMID: 27716526 Review.
  • Understanding Language Evolution: Beyond Pan-Centrism.
    Lameira AR, Call J. Lameira AR, et al. Bioessays. 2020 Mar;42(3):e1900102. doi: 10.1002/bies.201900102. Epub 2020 Jan 29. Bioessays. 2020. PMID: 31994246 Review.

Cited by

References

    1. Li H, Durbin R (2011) Inference of human population history from individual whole-genome sequences. Nature 475: 493–496. - PMC - PubMed
    1. Burgess R, Yang Z (2008) Estimation of hominoid ancestral population sizes under bayesian coalescent models incorporating mutation rate variation and sequencing errors. Mol Biol Evol 25: 1979–1994. - PubMed
    1. Wang Y, Hey J (2010) Estimating divergence parameters with small samples from a large number of loci. Genetics 184: 363–379. - PMC - PubMed
    1. Hey J (2010) Isolation with migration models for more than two populations. Mol Biol Evol 27: 905–920. - PMC - PubMed
    1. Yang Z (2010) A likelihood ratio test of speciation with gene ow using genomic sequence data. Genome Biology and Evolution 2: 200–211. - PMC - PubMed

Publication types