. 2012;8(12):e1003157.
doi: 10.1371/journal.pgen.1003157. Epub 2012 Dec 20.

Long-range regulatory polymorphisms affecting a GABA receptor constitute a quantitative trait locus (QTL) for social behavior in Caenorhabditis elegans

Affiliations

Long-range regulatory polymorphisms affecting a GABA receptor constitute a quantitative trait locus (QTL) for social behavior in Caenorhabditis elegans

Andres Bendesky et al. PLoS Genet. 2012.

Abstract

Aggregation is a social behavior that varies between and within species, providing a model to study the genetic basis of behavioral diversity. In the nematode Caenorhabditis elegans, aggregation is regulated by environmental context and by two neuromodulatory pathways, one dependent on the neuropeptide receptor NPR-1 and one dependent on the TGF-β family protein DAF-7. To gain further insight into the genetic regulation of aggregation, we characterize natural variation underlying behavioral differences between two wild-type C. elegans strains, N2 and CB4856. Using quantitative genetic techniques, including a survey of chromosome substitution strains and QTL analysis of recombinant inbred lines, we identify three new QTLs affecting aggregation in addition to the two known N2 mutations in npr-1 and glb-5. Fine-mapping with near-isogenic lines localized one QTL, accounting for 5%-8% of the behavioral variance between N2 and CB4856, 3' to the transcript of the GABA neurotransmitter receptor gene exp-1. Quantitative complementation tests demonstrated that this QTL affects exp-1, identifying exp-1 and GABA signaling as new regulators of aggregation. exp-1 interacts genetically with the daf-7 TGF-β pathway, which integrates food availability and population density, and exp-1 mutations affect the level of daf-7 expression. Our results add to growing evidence that genetic variation affecting neurotransmitter receptor genes is a source of natural behavioral variation.


Conflict of interest statement

The authors have declared that no competing interests exist.

Figures
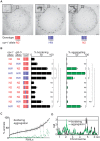
Figure 1
Figure 1. Identification of QTLs for social behavior.
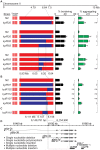
(A) Behavior of N2 animals (left), HW animals (middle), and HW animals with the N2 npr-1 allele (right). Photographs were taken three days after three adult hermaphrodites produced self-progeny on plates seeded with E. coli OP50. Scale bar, 2 mm. Insets show individual solitary N2 animals, a group of aggregating HW animals, and aggregating and non-aggregating animals from the HW strain with the N2 npr-1 allele. For genotypes in all figures, red denotes N2 DNA, blue denotes HW DNA. (B) Bordering and aggregation behaviors of npr-1 near-isogenic lines (NILs) and of chromosome-substitution strains. In this and other figures, bordering and aggregation were measured on 150 adult animals two hours after transferring to E. coli OP50 seeded plates (see Methods); values represent the mean of at least three assays per strain. Error bars, s.e.m. * P<0.05, ** P<0.01, *** P<0.001, by ANOVA with Bonferroni test. ns, not significant. (C) Behaviors of 102 N2-HW recombinant inbred advanced intercross lines (RIAILs) that carry the N2 npr-1 allele. (D) QTL analysis of RIAILs shown in (C). The horizontal line denotes the P<0.05 genome-wide significance threshold. lod, log likelihood ratio.
Figure 2
Figure 2. A social behavior II-QTL maps to a 6.2 kb region.
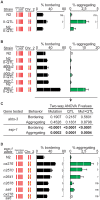
(A) Bordering and aggregation behaviors of recombinants in the II-QTL region introduced as NILs into an N2 background. (B) Behaviors of NILs derived from kyIR97. (C) Behaviors of kyIR110, a near-isogenic line containing 45 kb of HW DNA in an N2 background. (D) Expansion of the 6.2 kb QTL, showing polymorphisms between N2 and HW, location of transcripts (see Methods), and location of deletion alleles used in Figure 3 and Figure 4. Error bars, s.e.m. * P<0.05, ** P<0.01, *** P<0.001 by t-test or ANOVA with Dunnett test. ns, not significant.
Figure 3
Figure 3. exp-1 is a quantitative trait gene for bordering and aggregation.
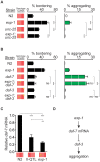
(A) Dominance test between N2 and the II-QTL (n = 7). (B) Quantitative complementation tests between the HW II-QTL, N2, and deletion mutants abts-3(ok368) and exp-1(ox276). Heterozygote F1 progeny from crosses were identified using a fluorescent marker (n = 6 assays for each cross). Yellow ‘x’ denotes a deletion mutation. A transgenic fluorescent marker used to identify F1s in this cross elevated bordering slightly and may also accentuate aggregation (see Figure S4). (C) Analysis of variance of data in panel (B). Two-way ANOVA used Mutation (N2 vs mutant allele) and QTL (N2 vs II-QTL) as variables and was performed for both abts-3(ok368) and exp-1(ox276) mutations. A significant P value for the Mut×QTL interaction indicates failure to complement, a defining feature of quantitative trait genes , . (D) Behaviors of exp-1(ox276), a deletion allele, exp-1(n2570), exp-1(n2641), exp-1(n2676), and exp-1(sa6) missense alleles, and exp-1(ox276)/exp-1(sa6) trans-heterozygotes. Yellow ‘x’ denotes a mutation. Error bars, s.e.m. In (A) and (D), * P<0.05, ** P<0.01, *** P<0.001 by ANOVA with Dunnett test. ns, not significant.
Figure 4
Figure 4. exp-1 acts with GABA and daf-7 TGF-β to regulate bordering and aggregation.
(A) Behaviors of exp-1(ox276), unc-25(n2324), and double mutants. (B) Behaviors of exp-1(ox276), daf-7(e1372), daf-3(e1376), and double mutants. (C) Relative amounts of daf-7 mRNA in N2, HW II-QTL kyIR110 near-isogenic line, and exp-1(ox276), measured by quantitative RT-PCR, (D) Model for exp-1 effects on aggregation. In (A) and (B), error bars, s.e.m. *** P<0.001 by ANOVA with Bonferroni test. ns, not significant. In (C), error bars, 95% C.I. ** P<0.01, *** P<0.001 by t-tests with Bonferroni correction.

References

    1. Bendesky A, Bargmann CI (2011) Genetic contributions to behavioural diversity at the gene-environment interface. Nat Rev Genet 12: 809–820. - PubMed
    1. Flint J (2003) Analysis of quantitative trait loci that influence animal behavior. J Neurobiol 54: 46–77. - PubMed
    1. Flint J, Mackay TF (2009) Genetic architecture of quantitative traits in mice, flies, and humans. Genome Res 19: 723–733. - PMC - PubMed
    1. Mundy P, Sigman M, Ungerer J, Sherman T (1986) Defining the social deficits of autism: the contribution of non-verbal communication measures. J Child Psychol Psychiatry 27: 657–669. - PubMed
    1. Tandon R, Nasrallah HA, Keshavan MS (2009) Schizophrenia, “just the facts” 4. Clinical features and conceptualization. Schizophr Res 110: 1–23. - PubMed

Publication types

MeSH terms