

Unprecedented mass bleaching and loss of coral across 12° of latitude in Western Australia in 2010-11
- PMID: 23284773
- PMCID: PMC3524109
- DOI: 10.1371/journal.pone.0051807
Unprecedented mass bleaching and loss of coral across 12° of latitude in Western Australia in 2010-11
Abstract
Background: Globally, coral bleaching has been responsible for a significant decline in both coral cover and diversity over the past two decades. During the summer of 2010-11, anomalous large-scale ocean warming induced unprecedented levels of coral bleaching accompanied by substantial storminess across more than 12° of latitude and 1200 kilometers of coastline in Western Australia (WA).
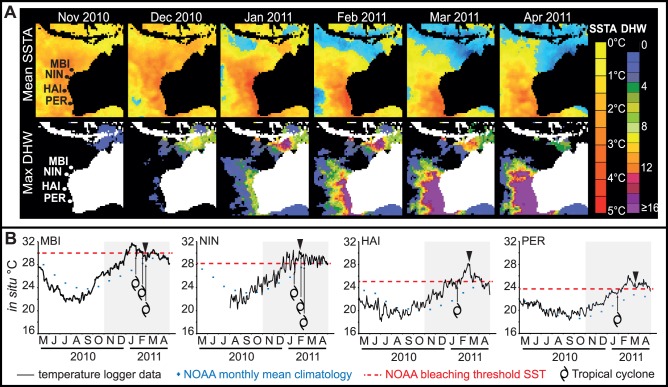
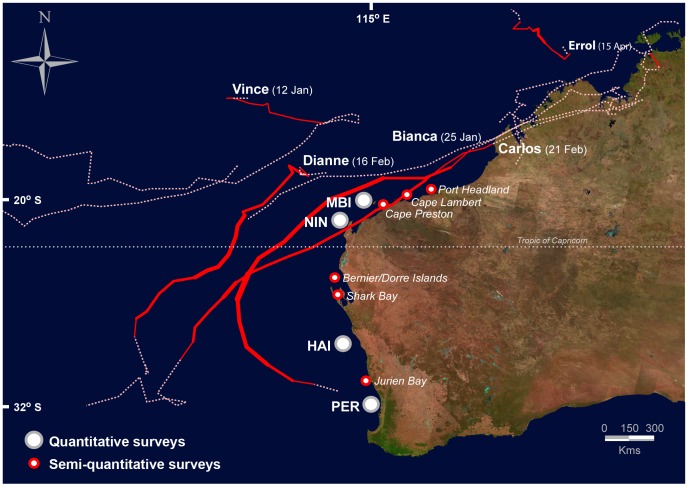
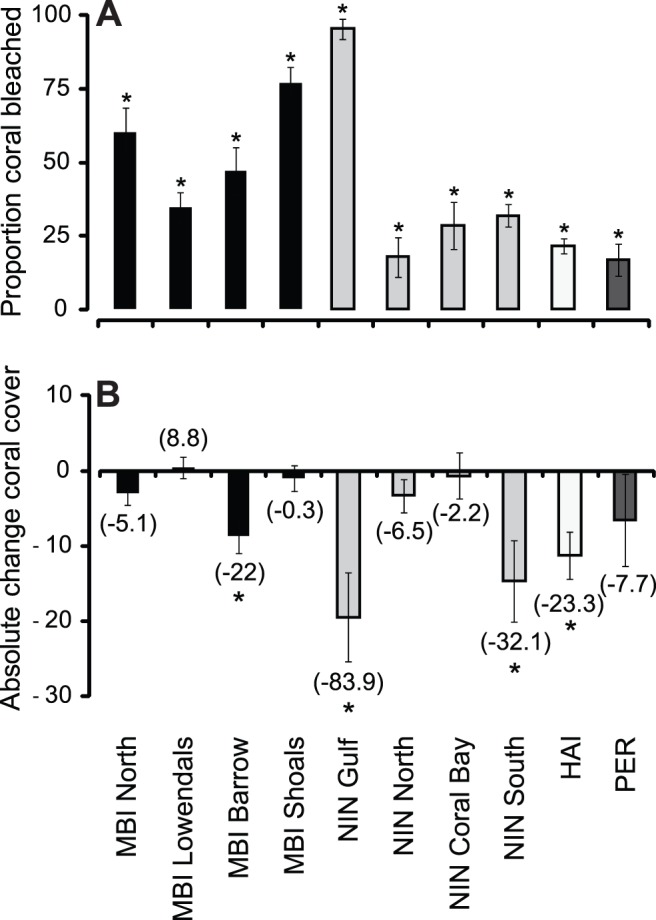
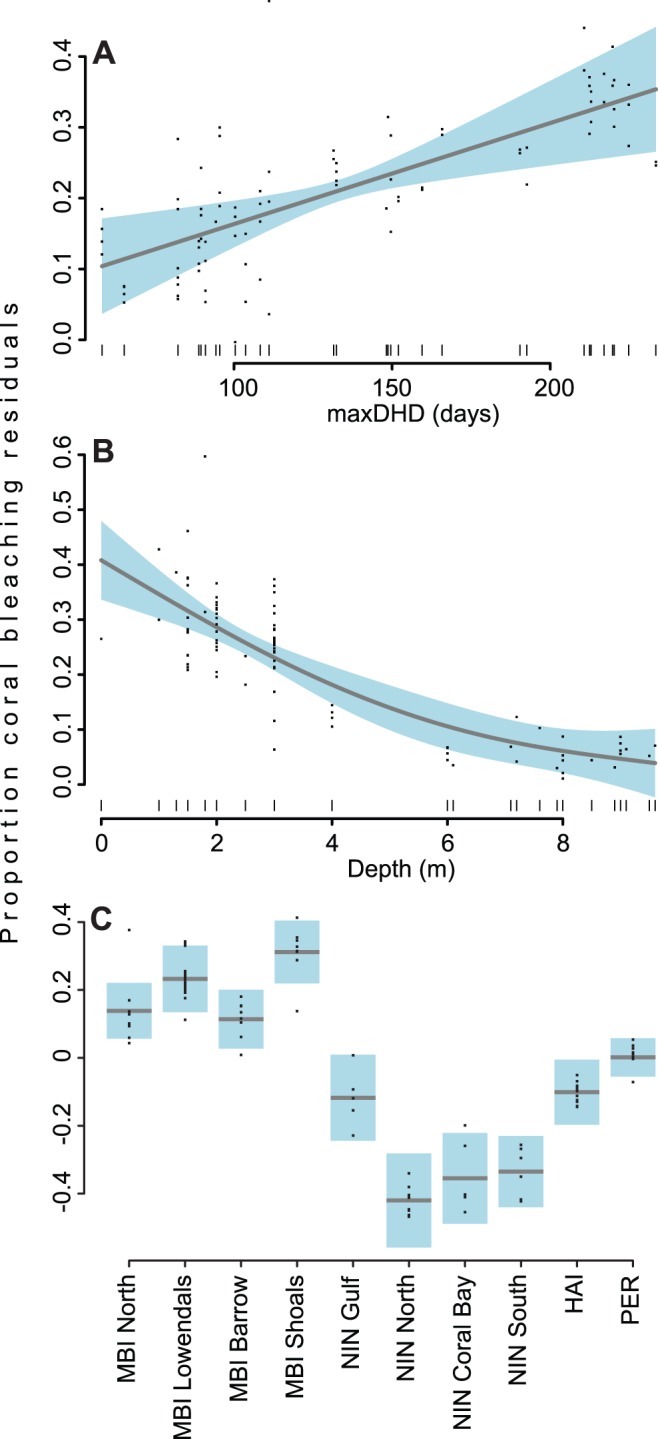
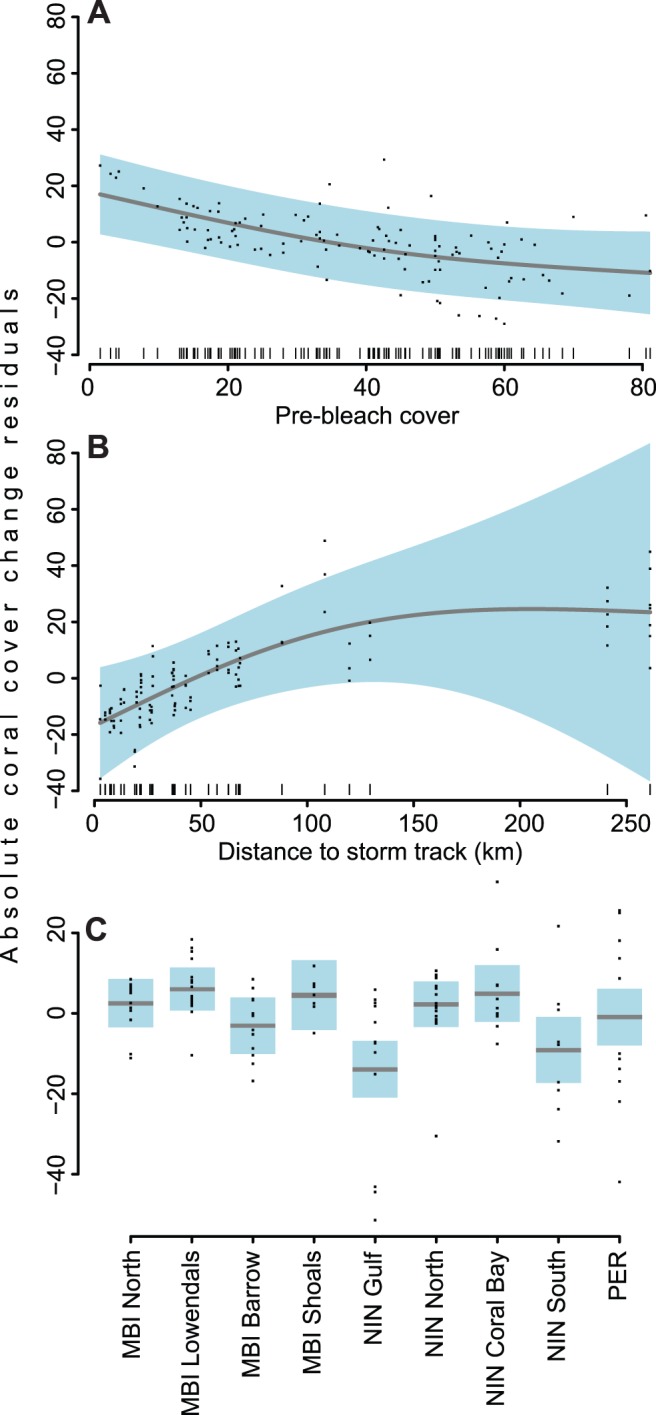
Methodology/principal findings: Extreme La-Niña conditions caused extensive warming of waters and drove considerable storminess and cyclonic activity across WA from October 2010 to May 2011. Satellite-derived sea surface temperature measurements recorded anomalies of up to 5°C above long-term averages. Benthic surveys quantified the extent of bleaching at 10 locations across four regions from tropical to temperate waters. Bleaching was recorded in all locations across regions and ranged between 17% (±5.5) in the temperate Perth region, to 95% (±3.5) in the Exmouth Gulf of the tropical Ningaloo region. Coincident with high levels of bleaching, three cyclones passed in close proximity to study locations around the time of peak temperatures. Follow-up surveys revealed spatial heterogeneity in coral cover change with four of ten locations recording significant loss of coral cover. Relative decreases ranged between 22%-83.9% of total coral cover, with the greatest losses in the Exmouth Gulf.
Conclusions/significance: The anomalous thermal stress of 2010-11 induced mass bleaching of corals along central and southern WA coral reefs. Significant coral bleaching was observed at multiple locations across the tropical-temperate divide spanning more than 1200 km of coastline. Resultant spatially patchy loss of coral cover under widespread and high levels of bleaching and cyclonic activity, suggests a degree of resilience for WA coral communities. However, the spatial extent of bleaching casts some doubt over hypotheses suggesting that future impacts to coral reefs under forecast warming regimes may in part be mitigated by southern thermal refugia.
Conflict of interest statement
Figures
References
-
- Wilkinson CR (2008) Status of coral reefs of the world: 2008. Townsville, Australia: Global Coral Reef Monitoring Network and Reef and Rainforest Research Centre. 296 pp.
-
- Wilkinson CR, Linden O, Cesar H, Hodgson G, Rubens J, et al. (1999) Ecological and socioeconomic impacts of 1998 coral mortality in the Indian Ocean: An ENSO impact and a warning of future change? Ambio 28: 188–196.
-
- Goreau TJ, Hayes RL (1994) Coral bleaching and ocean “hot spots.”. Ambio 23: 176–180.
-
- Goreau TJ, McClanahan T, Hayes R, Strong AE (2000) Conservation of Coral Reefs after the 1998 Global Bleaching Event. Conserv Biol 14: 5–15.
-
- Berkelmans R, De’ath G, Kininmonth S, Skirving WJ (2004) A comparison of the 1998 and 2002 coral bleaching events on the Great Barrier Reef: spatial correlation, patterns, and predictions. Coral Reefs 23: 74–83 doi:10.1007/s00338-003-0353-y. - DOI
Publication types
MeSH terms
LinkOut - more resources
Full Text Sources
Miscellaneous
