

Noise propagation in gene regulation networks involving interlinked positive and negative feedback loops
- PMID: 23284787
- PMCID: PMC3527455
- DOI: 10.1371/journal.pone.0051840
Noise propagation in gene regulation networks involving interlinked positive and negative feedback loops
Abstract
It is well known that noise is inevitable in gene regulatory networks due to the low-copy numbers of molecules and local environmental fluctuations. The prediction of noise effects is a key issue in ensuring reliable transmission of information. Interlinked positive and negative feedback loops are essential signal transduction motifs in biological networks. Positive feedback loops are generally believed to induce a switch-like behavior, whereas negative feedback loops are thought to suppress noise effects. Here, by using the signal sensitivity (susceptibility) and noise amplification to quantify noise propagation, we analyze an abstract model of the Myc/E2F/MiR-17-92 network that is composed of a coupling between the E2F/Myc positive feedback loop and the E2F/Myc/miR-17-92 negative feedback loop. The role of the feedback loop on noise effects is found to depend on the dynamic properties of the system. When the system is in monostability or bistability with high protein concentrations, noise is consistently suppressed. However, the negative feedback loop reduces this suppression ability (or improves the noise propagation) and enhances signal sensitivity. In the case of excitability, bistability, or monostability, noise is enhanced at low protein concentrations. The negative feedback loop reduces this noise enhancement as well as the signal sensitivity. In all cases, the positive feedback loop acts contrary to the negative feedback loop. We also found that increasing the time scale of the protein module or decreasing the noise autocorrelation time can enhance noise suppression; however, the systems sensitivity remains unchanged. Taken together, our results suggest that the negative/positive feedback mechanisms in coupled feedback loop dynamically buffer noise effects rather than only suppressing or amplifying the noise.
Conflict of interest statement
Figures
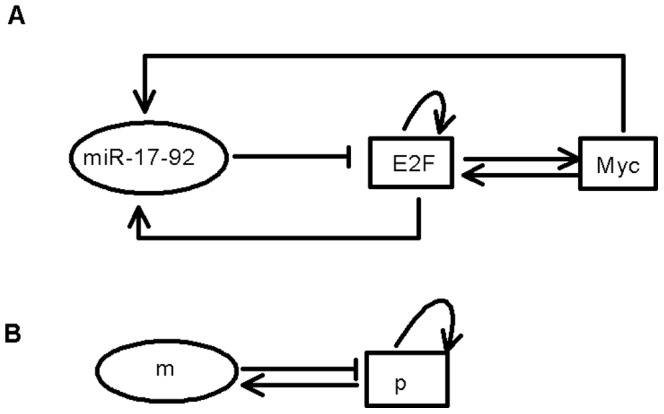
 and
and  represent the protein module (Myc and E2Fs) and the miR-17-92 gene cluster, respectively.
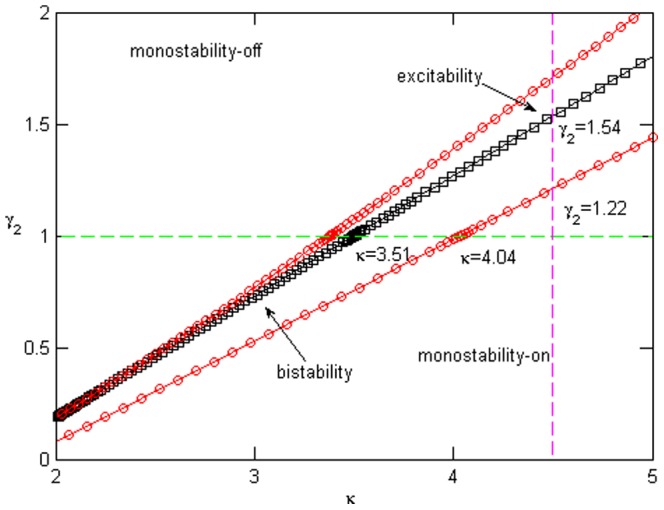
 and
and  , respectively. The parameter values are
  ,
,  , and
, and  .
.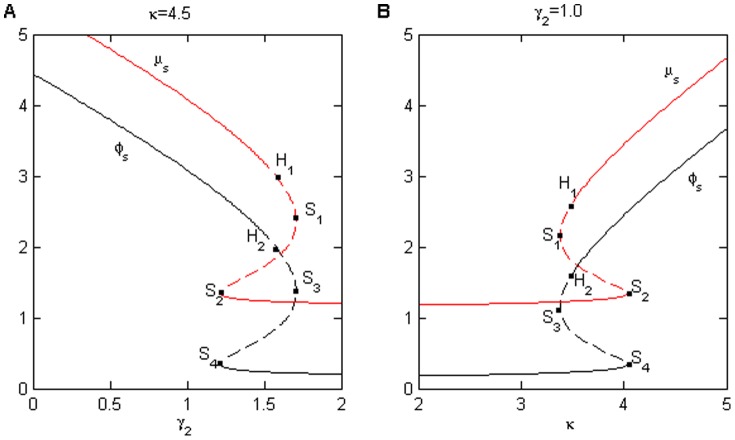
 denote saddle points and
  represent a Hopf bifurcations. Clearly, the system has completed the transitions (A) from monostability to bistability to excitability, and has finally transitioned to monostability with increasing
  or (B) from monostability to excitability to bistability, and has finally transitioned to monostability with increasing
  . The parameter values are
  ,
,  ,
,  , and
, and  .
.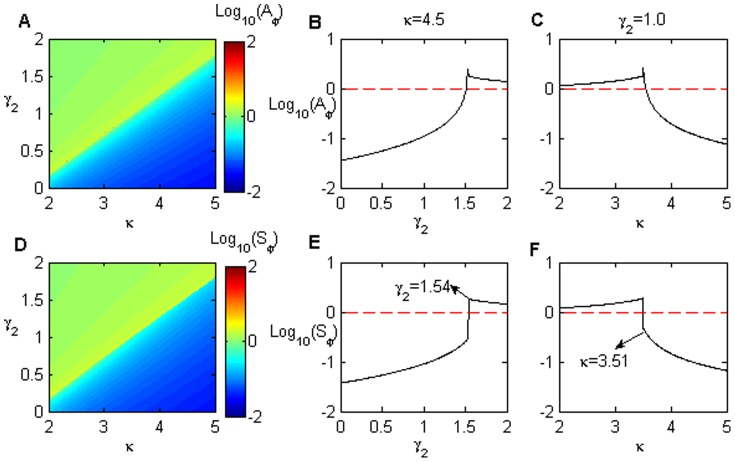
 and
and  when the initial stable steady state is on-state in a bistable region.
  and
and  for
for  (B, E) and
  (C, F), respectively. Note that
  and
and  reach their maximum values at
  (B, E) and
  (C, F), respectively. The parameters values are
  ,
,  ,
,  , and
, and  .
.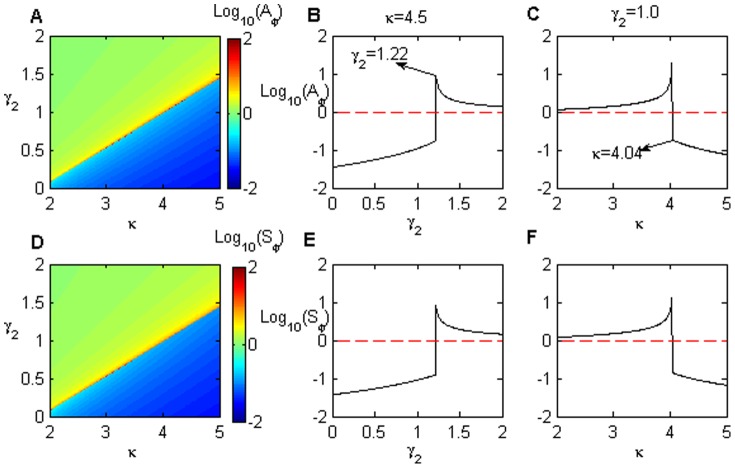
 and
and  when the initial steady state is an off-state in the bistable region. The parameter values are
  ,
,  ,
,  ,
,  .
.  and
and  for
for  (B, E) and
  (C, F), respectively. Note that
  and
and  reach their maximum values at
  (B, E) and
  (C, F), respectively.
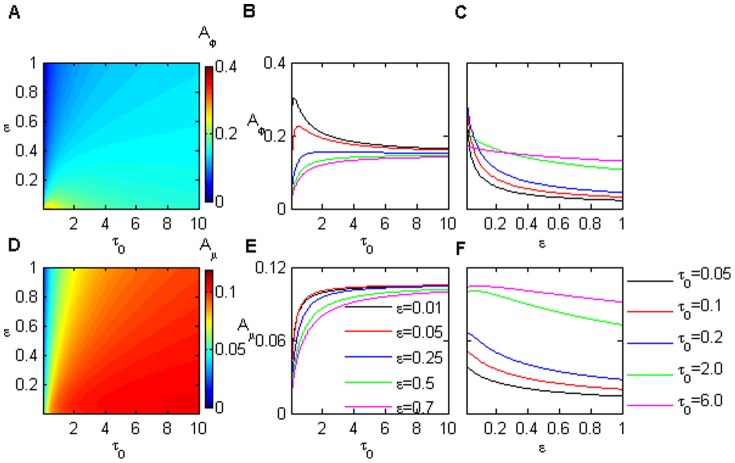
 and
and  . The noise amplification evolutes with
  in input signal for various
  (B, E), and
  for different
  (C, F) for protein and miRNA modules, respectively. The parameter values are
  ,
,  ,
,  ,
,  .
.Similar articles
-
MicroRNA-mediated positive feedback loop and optimized bistable switch in a cancer network Involving miR-17-92.PLoS One. 2011;6(10):e26302. doi: 10.1371/journal.pone.0026302. Epub 2011 Oct 14. PLoS One. 2011. PMID: 22022595 Free PMC article.
-
MicroRNA regulation of a cancer network: consequences of the feedback loops involving miR-17-92, E2F, and Myc.Proc Natl Acad Sci U S A. 2008 Dec 16;105(50):19678-83. doi: 10.1073/pnas.0811166106. Epub 2008 Dec 9. Proc Natl Acad Sci U S A. 2008. PMID: 19066217 Free PMC article.
-
mRNA and miRNA Expression Analyses of the MYC/E2F/miR-17-92 Network in the Most Common Pediatric Brain Tumors.Int J Mol Sci. 2021 Jan 7;22(2):543. doi: 10.3390/ijms22020543. Int J Mol Sci. 2021. PMID: 33430425 Free PMC article.
-
Modeling microRNA-transcription factor networks in cancer.Adv Exp Med Biol. 2013;774:149-67. doi: 10.1007/978-94-007-5590-1_9. Adv Exp Med Biol. 2013. PMID: 23377973 Review.
-
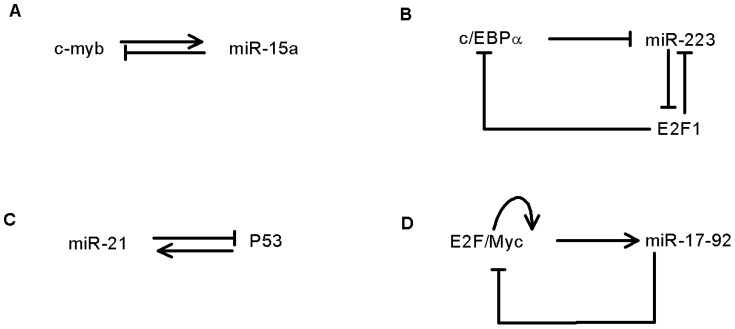
Noncoding RNAs Regulating p53 and c-Myc Signaling.Adv Exp Med Biol. 2016;927:337-65. doi: 10.1007/978-981-10-1498-7_13. Adv Exp Med Biol. 2016. PMID: 27376742 Review.
Cited by
-
Far Upstream Element Binding Protein Plays a Crucial Role in Embryonic Development, Hematopoiesis, and Stabilizing Myc Expression Levels.Am J Pathol. 2016 Mar;186(3):701-15. doi: 10.1016/j.ajpath.2015.10.028. Epub 2016 Jan 14. Am J Pathol. 2016. PMID: 26774856 Free PMC article.
-
Systematic analysis and optimization of early warning signals for critical transitions using distribution data.iScience. 2023 Jun 16;26(7):107156. doi: 10.1016/j.isci.2023.107156. eCollection 2023 Jul 21. iScience. 2023. PMID: 37456849 Free PMC article.
-
Positioning of negative feedback loops within immune signaling pathways influences gene expression noise.bioRxiv [Preprint]. 2025 Jun 6:2024.02.22.581613. doi: 10.1101/2024.02.22.581613. bioRxiv. 2025. PMID: 40501803 Free PMC article. Preprint.
-
Understanding microRNA-mediated gene regulatory networks through mathematical modelling.Nucleic Acids Res. 2016 Jul 27;44(13):6019-35. doi: 10.1093/nar/gkw550. Epub 2016 Jun 17. Nucleic Acids Res. 2016. PMID: 27317695 Free PMC article.
-
Systematic Design of a Metal Ion Biosensor: A Multi-Objective Optimization Approach.PLoS One. 2016 Nov 10;11(11):e0165911. doi: 10.1371/journal.pone.0165911. eCollection 2016. PLoS One. 2016. PMID: 27832110 Free PMC article.
References
-
- Ozbuda EM, Thattai M, Kurtser I, Grossman AD, van Oudenaarden A (2002) Regulation of noise in the expression of a single gene. Nat Genet 31: 69–73. - PubMed
-
- Elowitz MB, Levine AJ, Siggia ED, Swain PS (2002) Stochastic Gene Expression in a Single Cell. Science 297: 1183–1186. - PubMed
-
- Pedraza JM, Paulsson J (2008) Effects of Molecular Memory and Bursting on Fluctuations in Gene Expression. Science 319: 339–343. - PubMed
-
- Blake WJ, Kaern M, Cantor CR, Collins JJ (2003) Noise in eukaryotic gene expression. Nature 422: 633–637. - PubMed
MeSH terms
Substances
LinkOut - more resources
Full Text Sources
Medical
