

Hypothesis testing and power calculations for taxonomic-based human microbiome data
- PMID: 23284876
- PMCID: PMC3527355
- DOI: 10.1371/journal.pone.0052078
Hypothesis testing and power calculations for taxonomic-based human microbiome data
Abstract
This paper presents new biostatistical methods for the analysis of microbiome data based on a fully parametric approach using all the data. The Dirichlet-multinomial distribution allows the analyst to calculate power and sample sizes for experimental design, perform tests of hypotheses (e.g., compare microbiomes across groups), and to estimate parameters describing microbiome properties. The use of a fully parametric model for these data has the benefit over alternative non-parametric approaches such as bootstrapping and permutation testing, in that this model is able to retain more information contained in the data. This paper details the statistical approaches for several tests of hypothesis and power/sample size calculations, and applies them for illustration to taxonomic abundance distribution and rank abundance distribution data using HMP Jumpstart data on 24 subjects for saliva, subgingival, and supragingival samples. Software for running these analyses is available.
Conflict of interest statement
Figures
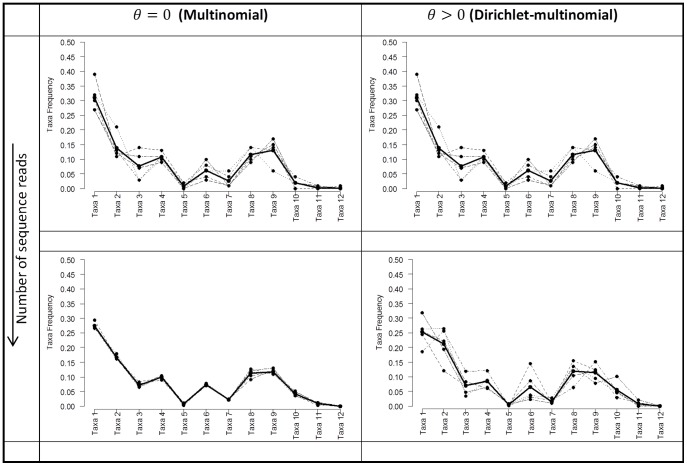
 . The four plots show the taxa frequencies
  for each of the five hypothetical samples (dashed lines) with 12 taxa in each sample, and the corresponding weighted average across the five samples given by the vector of taxa frequencies
  (solid line). The plots on the left show the taxa frequencies of samples drawn from a Multinomial distribution
  and the plots on the right show taxa frequencies of five samples drawn from a Dirichlet Multinomial
 . The top row of plots is for samples with a smaller number of sequence reads, while the bottom row of plots is for samples with a larger number of sequence reads. As the number of reads increases for the multinomial distribution increases each samples taxa frequencies converge onto the mean, while for the Dirichlet-multinomial an increased number of reads is still associated with the same variability between the individual samples.
References
Publication types
MeSH terms
Grants and funding
LinkOut - more resources
Full Text Sources
Other Literature Sources
Medical
