. 2012;7(12):e52120.
doi: 10.1371/journal.pone.0052120. Epub 2012 Dec 20.

Myocardial connective tissue growth factor (CCN2/CTGF) attenuates left ventricular remodeling after myocardial infarction

Affiliations

Myocardial connective tissue growth factor (CCN2/CTGF) attenuates left ventricular remodeling after myocardial infarction

Jørgen Gravning et al. PLoS One. 2012.

Abstract

Aims: Myocardial CCN2/CTGF is induced in heart failure of various etiologies. However, its role in the pathophysiology of left ventricular (LV) remodeling after myocardial infarction (MI) remains unresolved. The current study explores the role of CTGF in infarct healing and LV remodeling in an animal model and in patients admitted for acute ST-elevation MI.

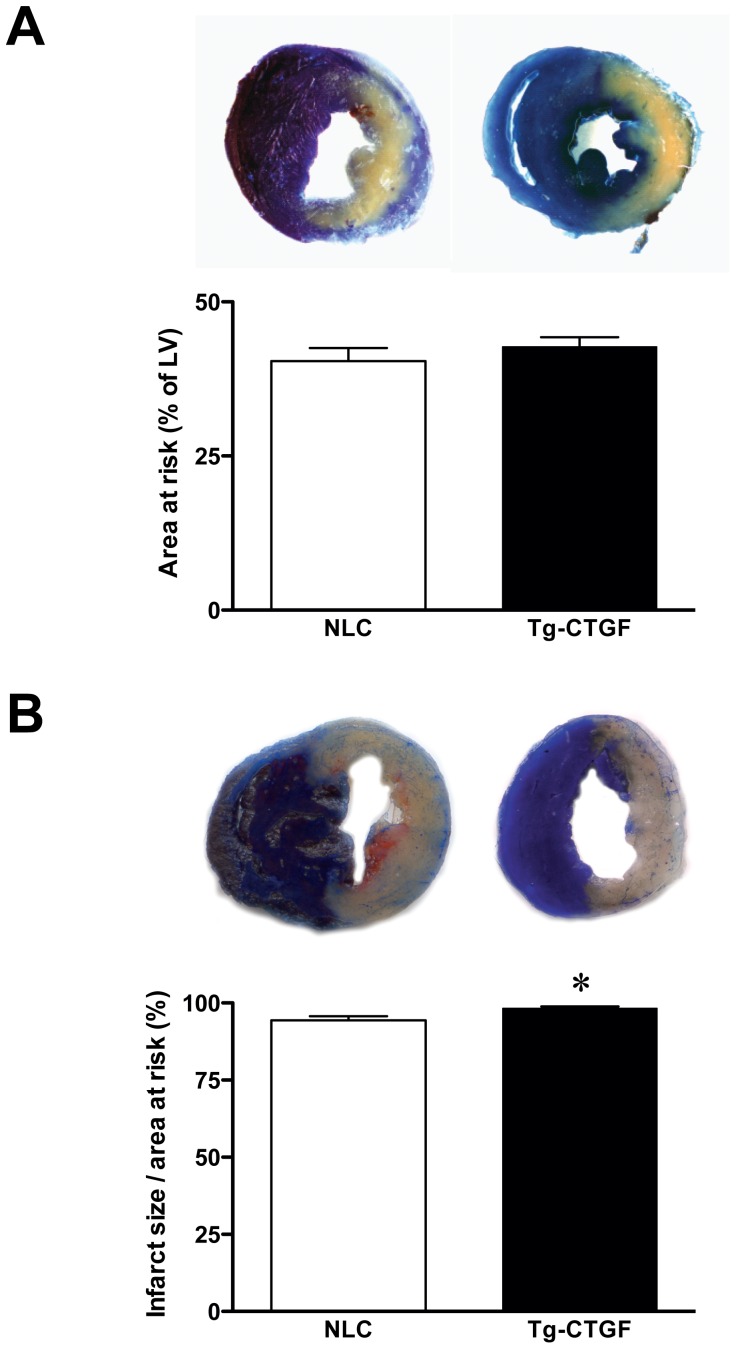
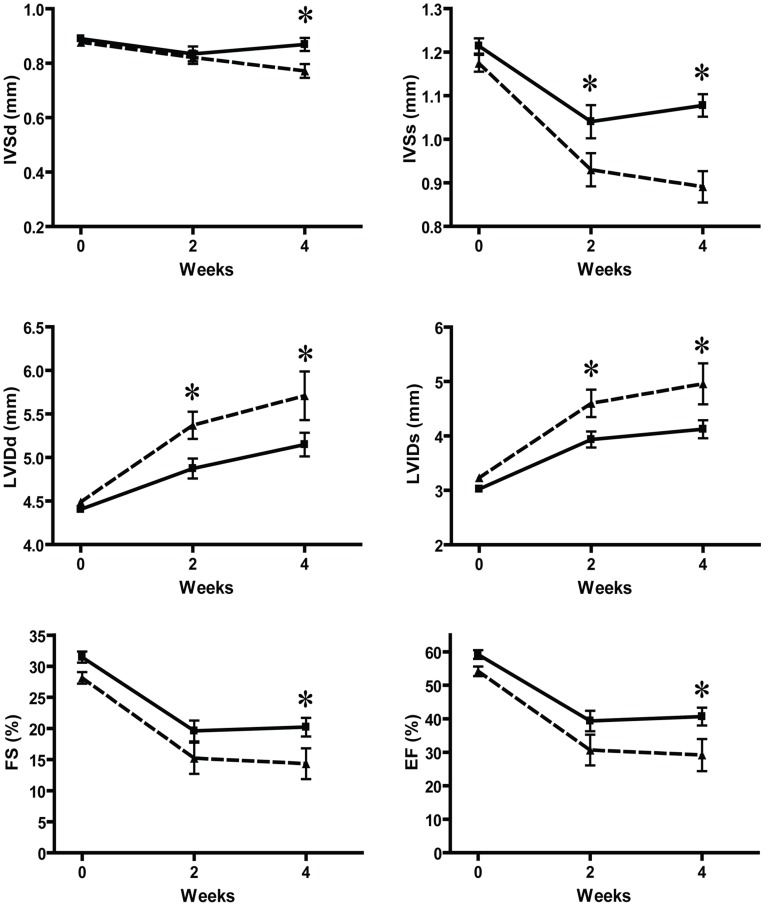
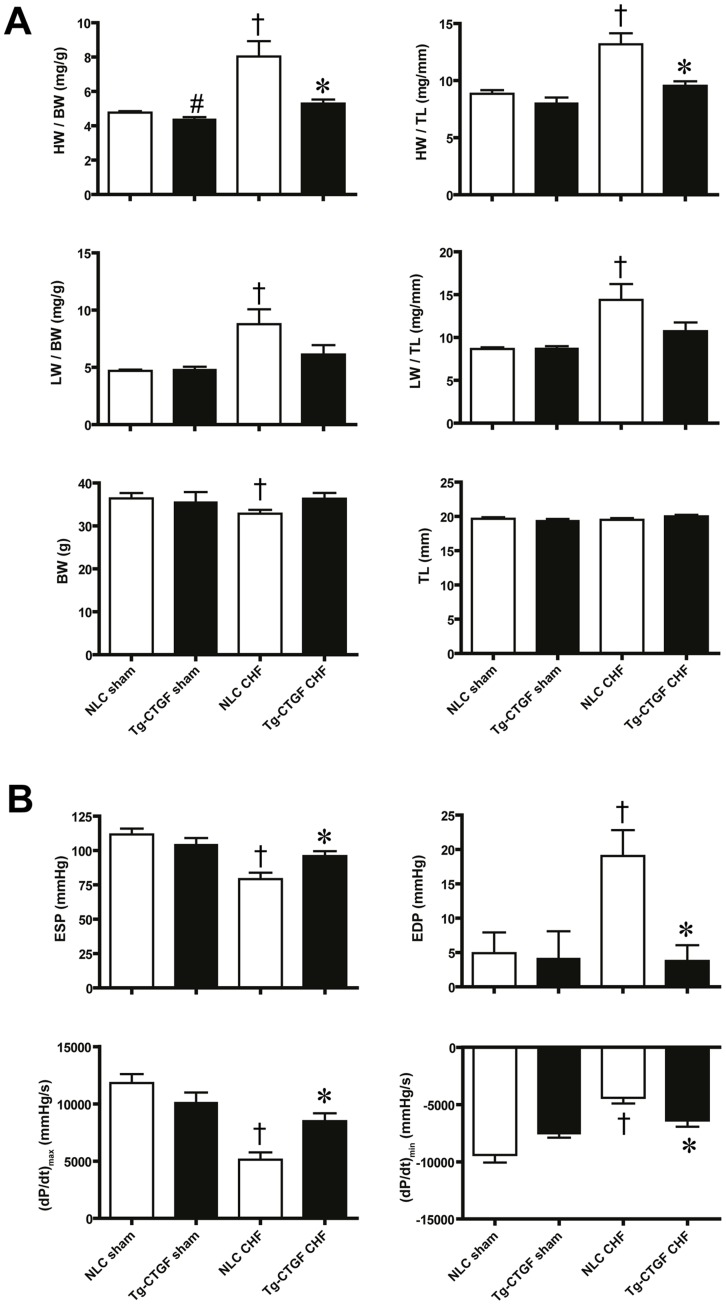
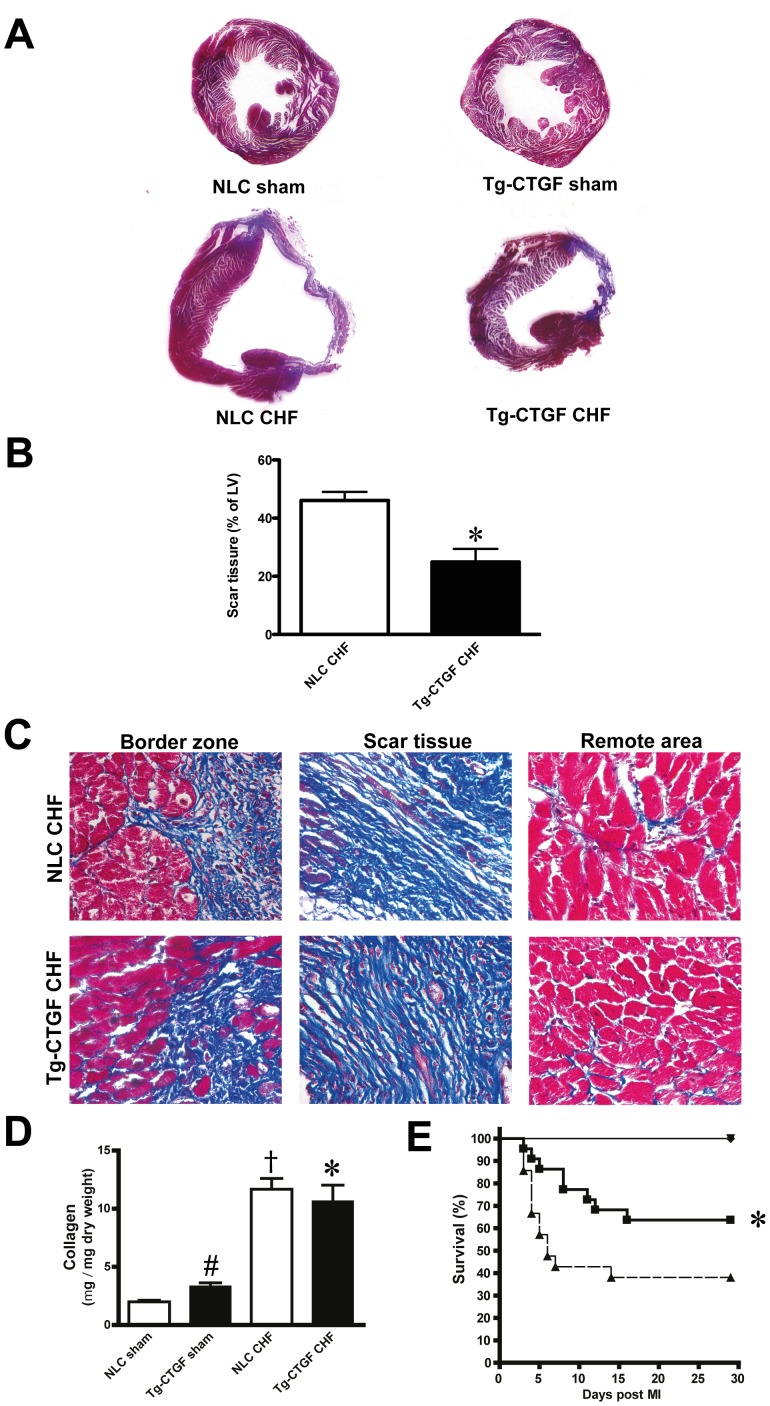
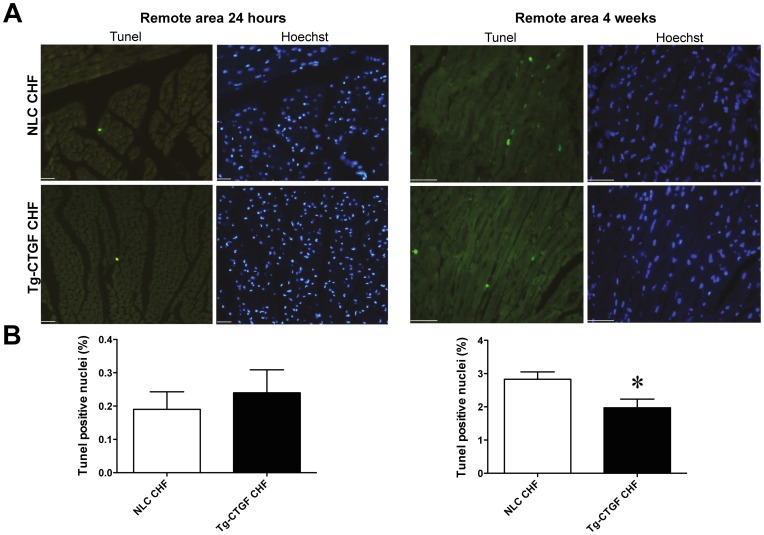
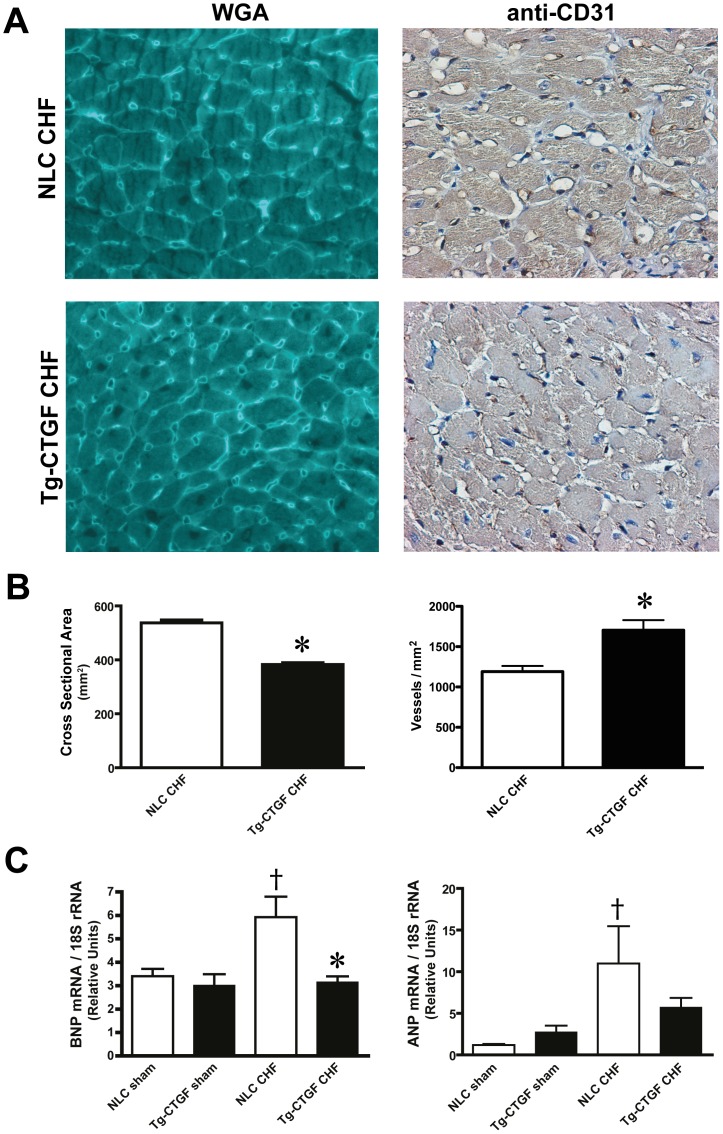
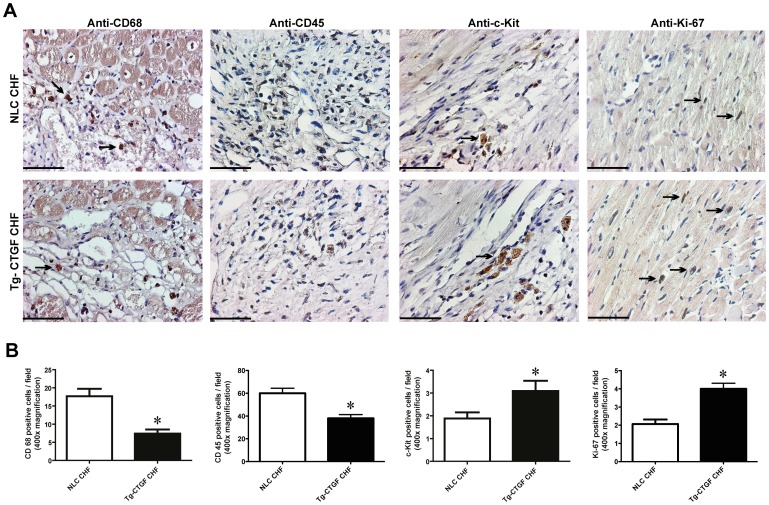
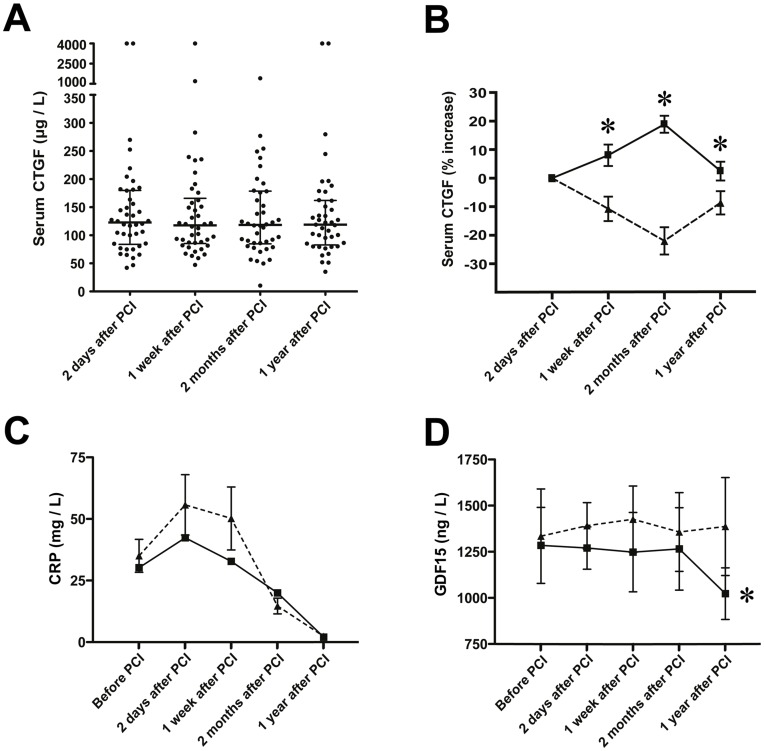
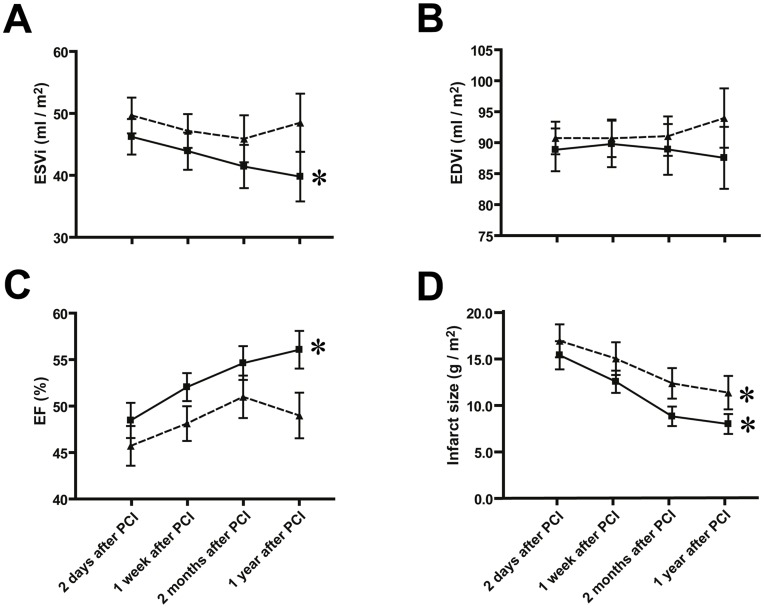
Methods and results: Transgenic mice with cardiac-restricted overexpression of CTGF (Tg-CTGF) and non-transgenic littermate controls (NLC) were subjected to permanent ligation of the left anterior descending coronary artery. Despite similar infarct size (area of infarction relative to area at risk) 24 hours after ligation of the coronary artery in Tg-CTGF and NLC mice, Tg-CTGF mice disclosed smaller area of scar tissue, smaller increase of cardiac hypertrophy, and less LV dilatation and deterioration of LV function 4 weeks after MI. Tg-CTGF mice also revealed substantially reduced mortality after MI. Remote/peri-infarct tissue of Tg-CTGF mice contained reduced numbers of leucocytes, macrophages, and cells undergoing apoptosis as compared with NLC mice. In a cohort of patients with acute ST-elevation MI (n = 42) admitted to hospital for percutaneous coronary intervention (PCI) serum-CTGF levels (s-CTGF) were monitored and related to infarct size and LV function assessed by cardiac MRI. Increase in s-CTGF levels after MI was associated with reduced infarct size and improved LV ejection fraction one year after MI, as well as attenuated levels of CRP and GDF-15.

Conclusion: Increased myocardial CTGF activities after MI are associated with attenuation of LV remodeling and improved LV function mediated by attenuation of inflammatory responses and inhibition of apoptosis.


Conflict of interest statement

Competing Interests: The authors Jørgen Gravning, Vladimir N. Martinov, M. Shakil Ahmed, and Håvard Attramadal are inventors in a patent application related to the potential application of CCN2/CTGF as a cardioprotectant (PCT/GB2009/002218;WO/2010/032007). This does not alter the authors' adherence to all the PLOS ONE policies on sharing data and materials.

Figures

Figure 1
Figure 1. Area at risk and infarct size in NLC and Tg-CTGF mice subjected to ligation of LAD.
A. Photomicrographs of representative myocardial sections of NLC and Tg-CTGF hearts perfused with Evans blue dye immediately after ligation of LAD. Histogram demonstrating area at risk in the left ventricles of NLC and Tg-CTGF mice determined by computerized planimetry after excision of the hearts. The data are mean±SEM of area at risk as percent of total LV area of NLC (n = 8) and Tg-CTGF mice (n = 8), respectively (40.4±2.1% vs. 42.7±1.6%, P = 0.39). B. Photomicrographs of representative myocardial sections of NLC and Tg-CTGF hearts 24 hours after ligation of LAD and subsequent perfusion with Evans blue dye and myocardial staining with TTC. Histogram demonstrating infarct size (area of necrosis relative to area at risk) 24 hours after ligation of LAD, determined as described in the Materials and Methods section. The data are mean±SEM of NLC (n = 6) and Tg-CTGF hearts (n = 6). *P<0.05 vs. NLC group.
Figure 2
Figure 2. Transthoracic echocardiography of NLC and Tg-CTGF mice at successive time points after MI.
Successive echocardiographic recordings of inter-ventricular septum thickness (IVS) and LV transverse diameter (LVID) at end-diastole and end-systole, as well as fractional shortening (FS) and estimated ejection fraction (EF) in the total number of NLC CHF (▴) and Tg-CTGF CHF mice (▪), at baseline and 2 and 4 weeks after ligation of LAD. Values are mean±SEM of NLC CHF and Tg-CTGF CHF mice. *P<0.05 vs. NLC group.
Figure 3
Figure 3. Gravimetric analyses and assessments of left ventricular pressures in NLC and Tg-CTGF mice after MI.
A. Histograms of cardiac mass (HW) and dry lung weight (LW) normalized to body weight (BW) or tibia length (TL) in NLC CHF (n = 8) and Tg-CTGF CHF (n = 14) 4 weeks after ligation of LAD and in corresponding NLC sham (n = 6) and Tg-CTGF sham (n = 5) animals. B. LV end-systolic pressure (ESP), end-diastolic pressure (EDP) and the contractile parameters (dP/dt)max and (dP/dt)min in NLC CHF (n = 8) vs. Tg-CTGF CHF mice (n = 11) subjected to LV catheterization. Data are presented as mean±SEM. *P<0.05 vs. NLC CHF mice, # P<0.05 vs. NLC sham, P<0.05 vs. corresponding sham group.
Figure 4
Figure 4. Assessments of survival and myocardial fibrosis after MI in NLC and Tg-CTGF mice.
A. Transverse sections of the left ventricle (plane of papillary muscle) of hearts from NLC CHF and Tg-CTGF CHF mice 4 weeks after MI, and of hearts from corresponding sham animals, stained with Massońs trichrome stain. B. Representative images of Massońs trichrome-stained sections from border zone, scar tissue and remote area in Tg-CTGF CHF and NLC CHF mice. Magnification: ×400. C. Histograms demonstrating area of scar tissue as percentage of left ventricular area in NLC CHF (n = 4) and Tg-CTGF CHF mice (n = 4) 4 weeks after MI. Data are presented as mean±SEM. *P<0.05 vs. NLC CHF mice. D. Histogram demonstrating quantification of myocardial fibrosis by assay of myocardial collagen (hydroxyproline) by quantitative HPLC of HCl-hydrolyzed non-ischemic myocardial tissue 4 weeks after MI in NLC CHF (n = 6) vs. Tg-CTGF CHF mice (n = 11). Data are presented as mean±SEM. *P<0.05 vs. NLC CHF mice, # P<0.05 vs. NLC sham, P<0.05 vs. corresponding sham group. E. Kaplan-Meier plot demonstrating survival rates of Tg-CTGF mice (▪) versus NLC mice (▴) after MI. There were no deaths among sham animals (▾).
Figure 5
Figure 5. Morphometric analysis of myocardial cells undergoing apoptosis in NLC and Tg-CTGF mice after MI.
A. Representative photomicrographs of myocardial sections subjected to staining of cells undergoing apoptosis in remote myocardium of NLC CHF and Tg-CTGF CHF mice 24 hours and 4 weeks after MI. Sections are stained with TUNEL assay and Hoechst as detailed in the Materials and Methods section. Size bar indicates 100 µm. B. Histograms of TUNEL positive nuclei in the remote myocardium of NLC CHF and Tg-CTGF CHF mice 24 hours and 4 weeks after ligation of LAD. Two visual fields/section and 3 sections per mice were analyzed. Data are mean±SEM of Tg-CTGF CHF (n = 4) and NLC CHF mice (n = 4). *P<0.05 vs. NLC CHF group.
Figure 6
Figure 6. Cardiomyocyte cross-sectional area, microvessel densities, and mRNA expression markers of myocardial hypertrophy after MI.
A. Photomicrographs of representative transverse sections of NLC CHF and Tg-CTGF CHF mice 4 weeks after MI stained with WGA or anti-mouse CD31 IgG. B. Histograms demonstrating cardiac myocyte cross-sectional areas and microvessel densities in NLC CHF vs. Tg-CTGF CHF mice 4 weeks after MI determined in transverse myocardial sections after staining with rhodamine-labeled WGA and immunohistochemical staining with anti-CD31, respectively. C. Myocardial BNP and ANP mRNA levels 4 weeks after MI in NLC CHF (n = 6) and Tg-CTGF CHF mice (n = 11) versus respective sham groups. All values are presented as mean±SEM. *P<0.05 vs. NLC CHF mice, P<0.05 vs. corresponding sham group.
Figure 7
Figure 7. Morphometric analyses of inflammatory cells and cells undergoing apoptosis in myocardial tissue after MI.
Photomicrographs of immunohistochemical staining of CD68, CD45, c-Kit and Ki-67 in myocardial sections of hearts from NLC mice and Tg-CTGF mice 4 weeks after MI. Panels are from border zone of MI. Size bar indicates 50 µm. Arrows indicate examples of immunoreactive cells. Magnification: ×400. B. Histograms of CD68+-cells, CD45+-cells, c-kit+-cells and Ki-67+-cells (immunoreactive cells/400x power field) in peri-infarct region of NLC CHF and Tg-CTGF CHF mice 4 weeks after ligation of LAD. 5 visual fields/section and 3 sections per mice were analyzed. Data are mean±SEM of Tg-CTGF CHF (n = 4) and NLC CHF mice (n = 4). *P<0.05 vs. NLC CHF group.
Figure 8
Figure 8. Serum levels of CTGF, CRP and GDF-15 in patients after myocardial infarction.
A. Scatter-plot of serum CTGF levels at various time points after percutaneous coronary intervention in patients (n = 42) admitted for acute ST-elevation MI. Median serum CTGF levels and interquartile range (25th to 75th percentile) at each time point are indicated. B. Time course of s-CTGF levels after stratification of the patient cohort into two groups: patients that displayed increase in s-CTGF levels after MI (▪; n = 21), and patients in which s-CTGF levels remained unaltered or declined after MI (▴; n = 21). The figure demonstrates s-CTGF levels plotted as percent change from day 2 after PCI for each time point during the one-year follow-up after MI. Values are mean±SEM. *P<0.05 between groups. C–D. Panels demonstrating serial measurements of serum levels of CRP and GDF-15 in the two patient groups. Values are mean±SEM. *P<0.01 for intra-group comparisons.
Figure 9
Figure 9. Serial assessments of left ventricular volumes and infarct size in patients stratified according to s-CTGF levels after MI.
Panels demonstrating end-systolic volume index (ESVi) (A), end-diastolic volume index (EDVi) (B), ejection fraction (EF) (C) and infarct size (D) determined by CMR at successive time points from 2 days to 1 year after PCI in patients who responded with increase in s-CTGF levels after MI (▪; n = 21) compared with those in whom s-CTGF levels remained unaltered or decreased after MI (▴; n = 21). Values are mean±SEM. *P<0.01 for intra-group comparisons.

References

    1. Ørn S, Manhenke C, Anand IS, Squire I, Nagel E, et al. (2007) Effect of left ventricular scar size, location, and transmurality on left ventricular remodeling with healed myocardial infarction. Am J Cardiol 99: 1109–1114. - PubMed
    1. Ahmed MS, Øie E, Vinge LE, Yndestad A, Andersen GØ, et al. (2004) Connective tissue growth factor - a novel mediator of angiotensin II-stimulated cardiac fibroblast activation in heart failure in rats. J Mol Cell Cardiol 36: 393–404. - PubMed
    1. Chen MM, Lam A, Abraham JA, Schreiner GF, Joly AH (2000) CTGF expression is induced by TGF- beta in cardiac fibroblasts and cardiac myocytes: a potential role in heart fibrosis. J Mol Cell Cardiol 32: 1805–1819. - PubMed
    1. Koitabashi N, Arai M, Niwano K, Watanabe A, Endoh M, et al. (2008) Plasma connective tissue growth factor is a novel potential biomarker of cardiac dysfunction in patients with chronic heart failure. Eur J Heart Fail 10: 373–379. - PubMed
    1. Shi-Wen X, Leask A, Abraham D (2008) Regulation and function of connective tissue growth factor/CCN2 in tissue repair, scarring and fibrosis. Cytokine & growth factor reviews 19: 133–144. - PubMed

Publication types

MeSH terms

Substances