

Cellular redox imbalance and changes of protein S-glutathionylation patterns are associated with senescence induced by oncogenic H-ras
- PMID: 23284910
- PMCID: PMC3527427
- DOI: 10.1371/journal.pone.0052151
Cellular redox imbalance and changes of protein S-glutathionylation patterns are associated with senescence induced by oncogenic H-ras
Abstract
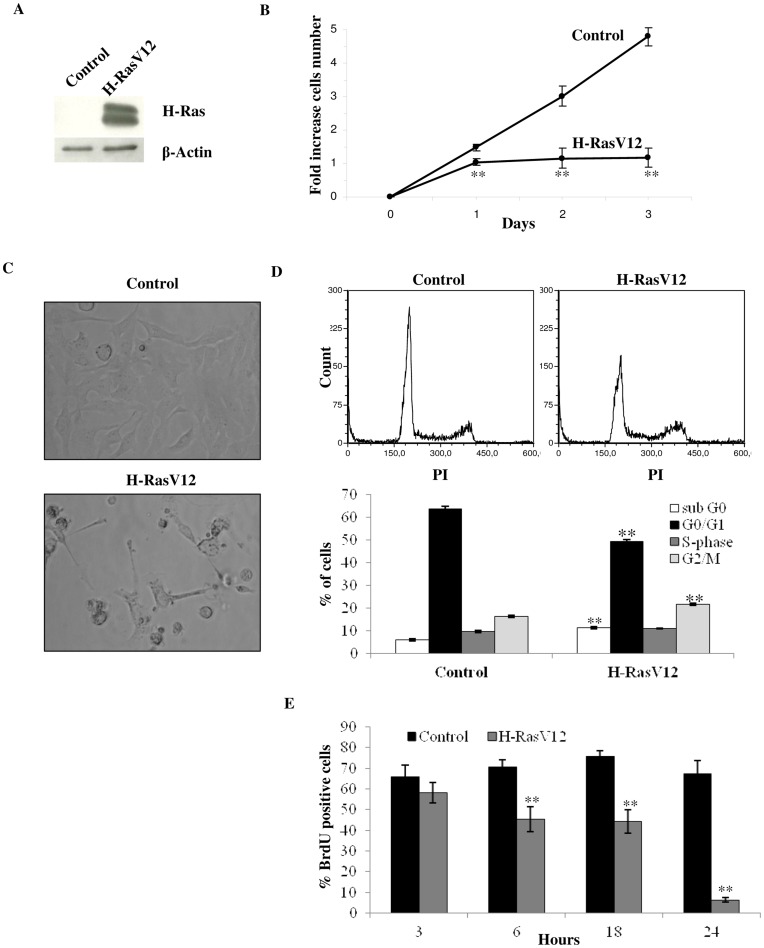
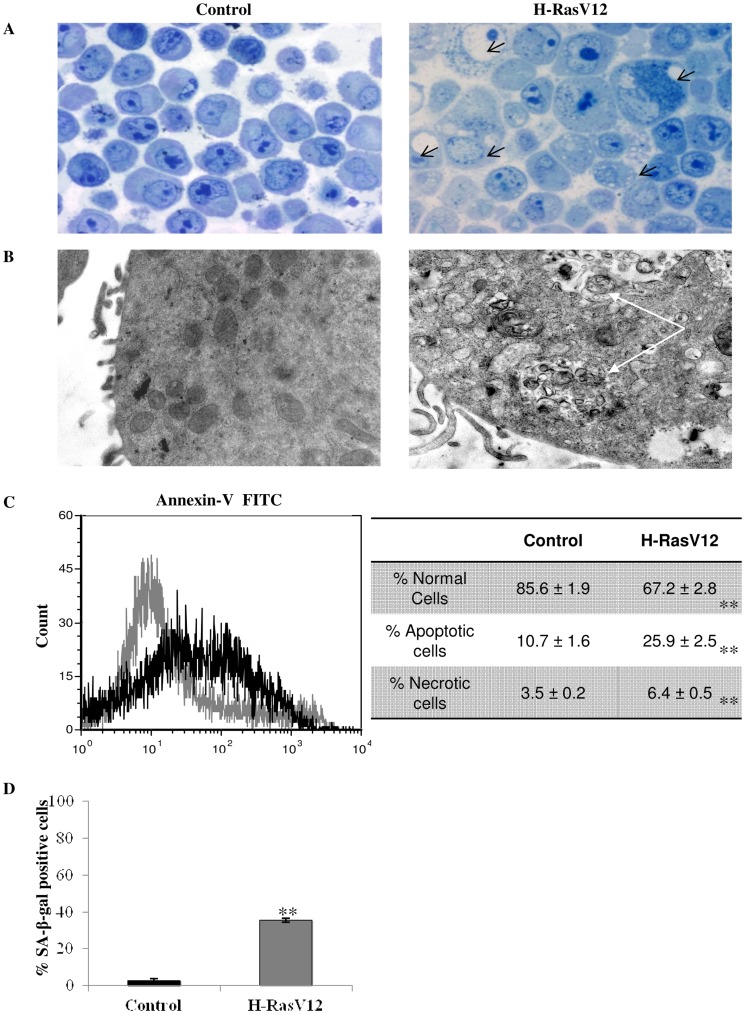
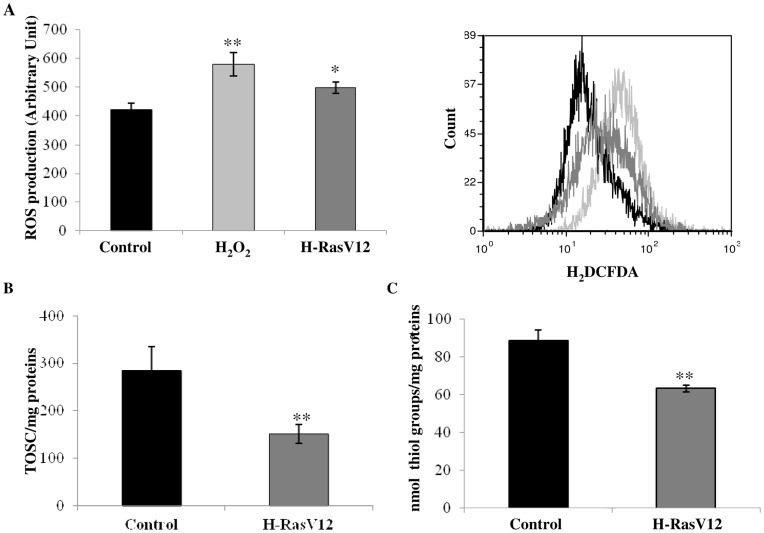
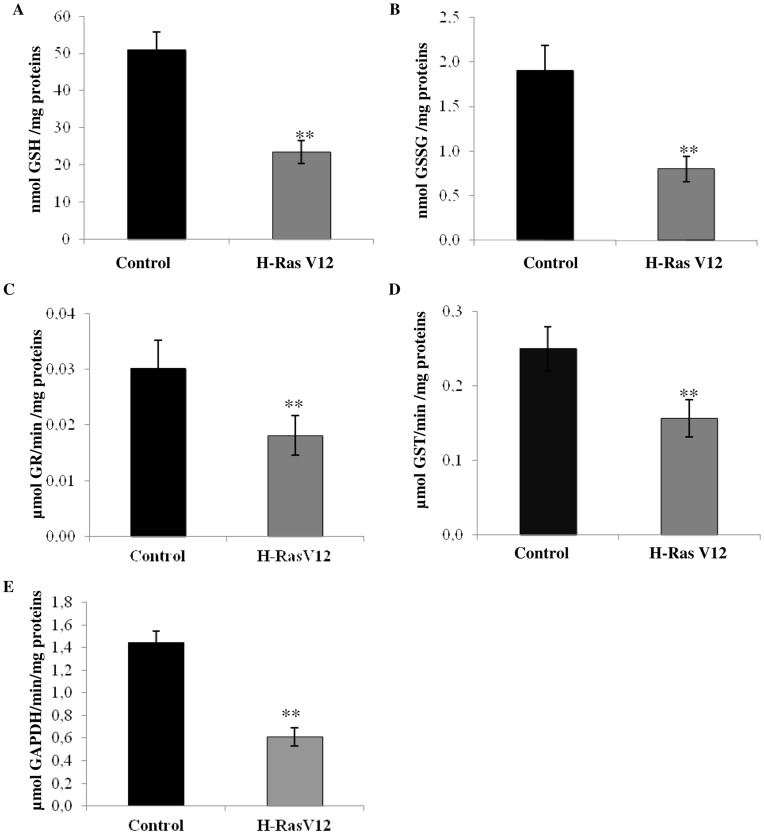
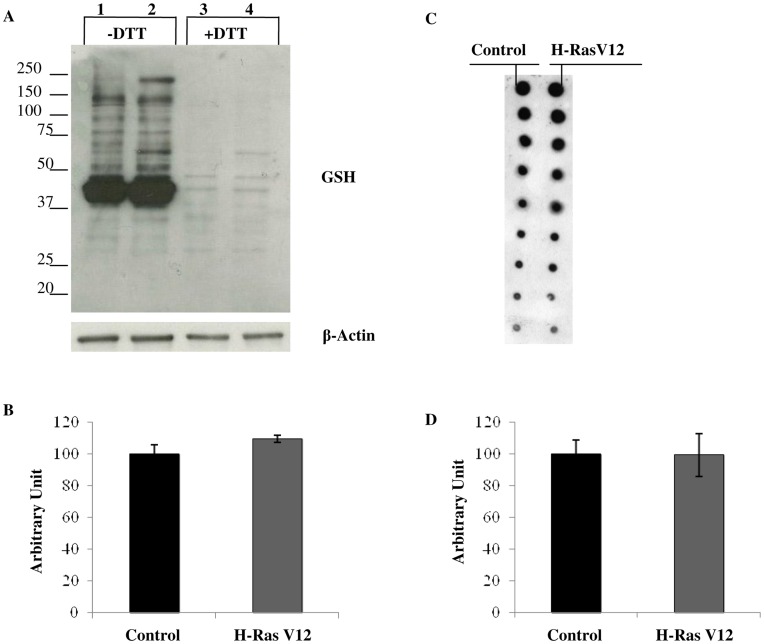
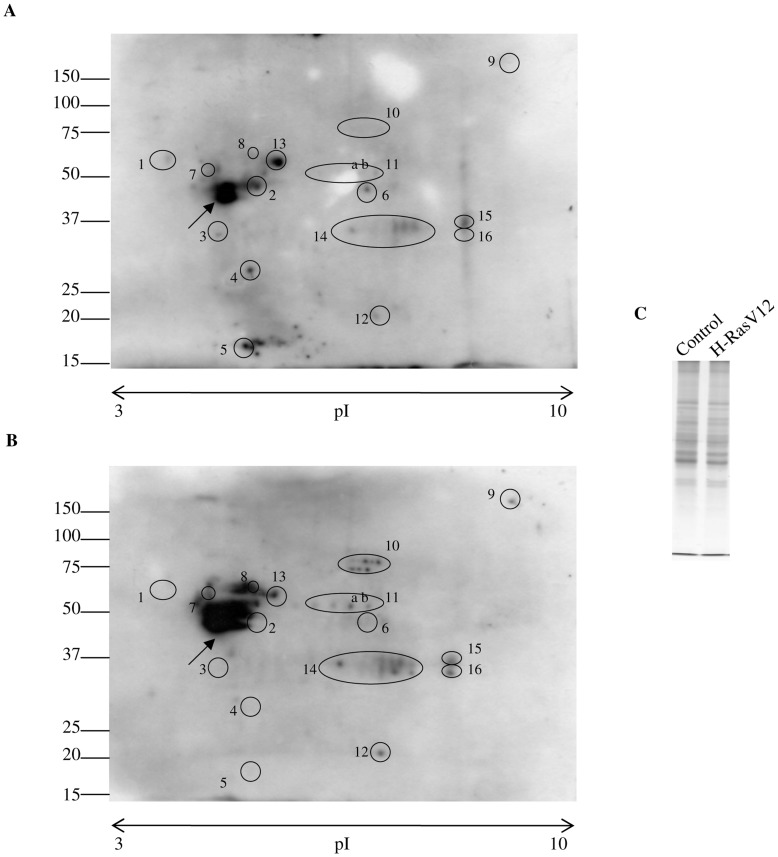
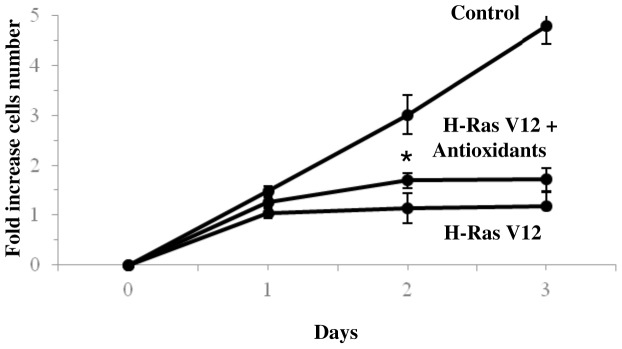
H-Ras oncogene requires deregulation of additional oncogenes or inactivation of tumor suppressor proteins to increase cell proliferation rate and transform cells. In fact, the expression of the constitutively activated H-RasV12 induces cell growth arrest and premature senescence, which act like barriers in pre-neoplastic lesions. In our experimental model, human fibroblasts transfected with H-RasV12 show a dramatic modification of morphology. H-RasV12 expressing cells also show premature senescence followed by cell death, induced by autophagy and apoptosis. In this context, we provide evidence that in H-RasV12 expressing cells, the premature senescence is associated with cellular redox imbalance as well as with altered post-translation protein modification. In particular, redox imbalance is due to a strong reduction of total antioxidant capacity, and significant decrease of glutathione level. As the reversible addition of glutathione to cysteinyl residues of proteins is an important post-translational regulative modification, we investigated S-glutathionylation in cells expressing active H-Ras. In this contest we observed different S-glutathionylation patterns in control and H-RasV12 expressing cells. Particularly, the GAPDH enzyme showed S-glutathionylation increase and significant enzyme activity depletion in H-Ras V12 cells. In conclusion, we proposed that antioxidant defense reduction, glutathione depletion and subsequent modification of S-glutathionylation of target proteins contribute to arrest cell growth, leading to death of fibroblasts expressing constitutively active H-Ras oncogene, thus acting as oncogenic barriers that obstacle the progression of cell transformation.
Conflict of interest statement
Figures
Similar articles
-
Bcl-2 promotes premature senescence induced by oncogenic Ras.Biochem Biophys Res Commun. 2003 Apr 11;303(3):800-7. doi: 10.1016/s0006-291x(03)00402-9. Biochem Biophys Res Commun. 2003. PMID: 12670482
-
Oncogenic ras and p53 cooperate to induce cellular senescence.Mol Cell Biol. 2002 May;22(10):3497-508. doi: 10.1128/MCB.22.10.3497-3508.2002. Mol Cell Biol. 2002. PMID: 11971980 Free PMC article.
-
Differential oncogenic Ras signaling and senescence in tumor cells.Cell Cycle. 2004 Sep;3(9):1201-7. Epub 2004 Sep 5. Cell Cycle. 2004. PMID: 15492501
-
ERK and cell death: mechanisms of ERK-induced cell death--apoptosis, autophagy and senescence.FEBS J. 2010 Jan;277(1):2-21. doi: 10.1111/j.1742-4658.2009.07366.x. Epub 2009 Oct 16. FEBS J. 2010. PMID: 19843174 Review.
-
S-glutathionylation, friend or foe in cardiovascular health and disease.Redox Biol. 2020 Oct;37:101693. doi: 10.1016/j.redox.2020.101693. Epub 2020 Aug 22. Redox Biol. 2020. PMID: 32912836 Free PMC article. Review.
Cited by
-
2-Acetylamino-3-[4-(2-acetylamino-2-carboxyethylsulfanylcarbonylamino) phenyl carbamoylsulfanyl] propionic acid, a glutathione reductase inhibitor, induces G2/M cell cycle arrest through generation of thiol oxidative stress in human esophageal cancer cells.Oncotarget. 2017 Jun 27;8(37):61846-61860. doi: 10.18632/oncotarget.18705. eCollection 2017 Sep 22. Oncotarget. 2017. PMID: 28977909 Free PMC article.
-
Cushing Syndrome: The Role of MSCs in Wound Healing, Immunosuppression, Comorbidities, and Antioxidant Imbalance.Front Cell Dev Biol. 2019 Oct 9;7:227. doi: 10.3389/fcell.2019.00227. eCollection 2019. Front Cell Dev Biol. 2019. PMID: 31649930 Free PMC article.
-
Oxidative stress and the unfulfilled promises of antioxidant agents.Ecancermedicalscience. 2015 Jul 23;9:556. doi: 10.3332/ecancer.2015.556. eCollection 2015. Ecancermedicalscience. 2015. PMID: 26284120 Free PMC article. Review.
-
Extracellular vesicles released by fibroblasts undergoing H-Ras induced senescence show changes in lipid profile.PLoS One. 2017 Nov 28;12(11):e0188840. doi: 10.1371/journal.pone.0188840. eCollection 2017. PLoS One. 2017. PMID: 29182668 Free PMC article.
-
Glyoxalase 2: Towards a Broader View of the Second Player of the Glyoxalase System.Antioxidants (Basel). 2022 Oct 28;11(11):2131. doi: 10.3390/antiox11112131. Antioxidants (Basel). 2022. PMID: 36358501 Free PMC article. Review.
References
-
- Land H, Parada LF, Weinberg RA (1983) Tumorigenic conversion of primary embryo fibroblasts requires at least two cooperating oncogenes. Nature 304: 596–602. - PubMed
-
- Elgendy M, Sheridan C, Brumatti G, Martin SJ (2011) Oncogenic Ras-induced expression of Noxa and Beclin-1 promotes autophagic cell death and limits clonogenic survival. Mol Cell 42: 23–35. - PubMed
-
- Hanahan D, Weinberg RA (2000) The hallmarks of cancer. Cell 100: 57–70. - PubMed
Publication types
MeSH terms
Substances
LinkOut - more resources
Full Text Sources
Research Materials
Miscellaneous
