

The forkhead transcription factor, Foxd1, is necessary for pituitary luteinizing hormone expression in mice
- PMID: 23284914
- PMCID: PMC3526578
- DOI: 10.1371/journal.pone.0052156
The forkhead transcription factor, Foxd1, is necessary for pituitary luteinizing hormone expression in mice
Abstract
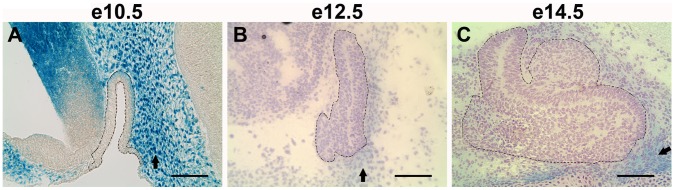
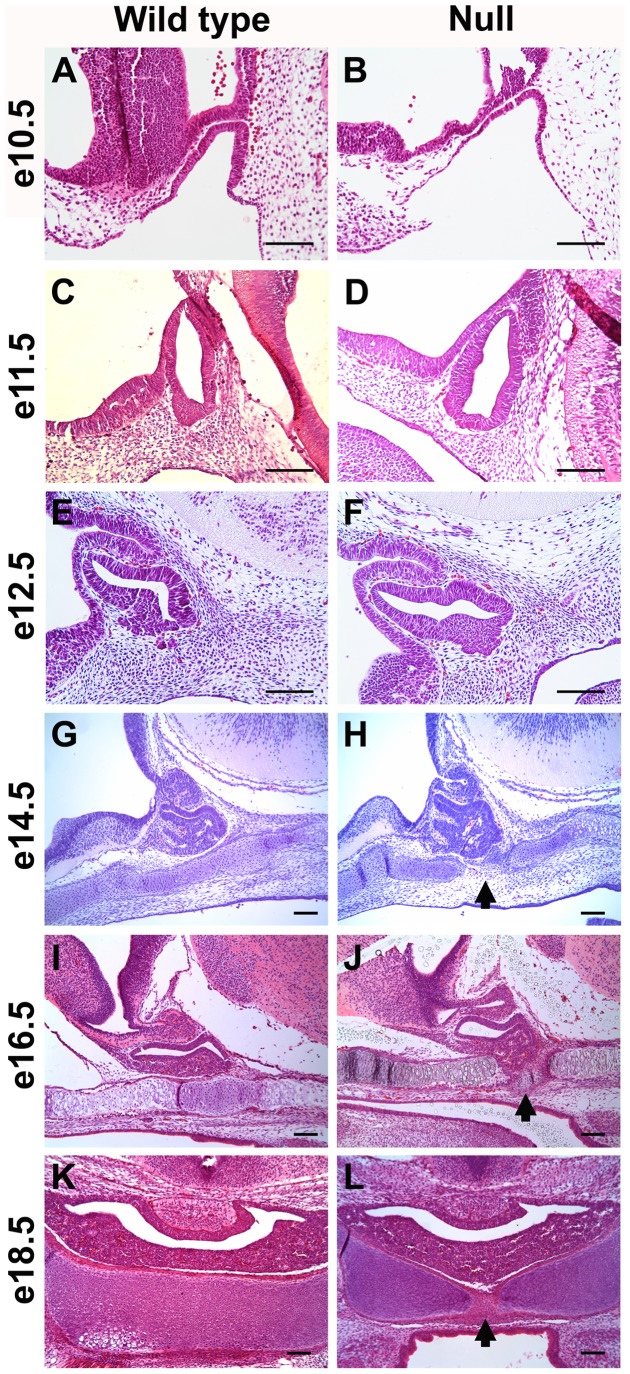
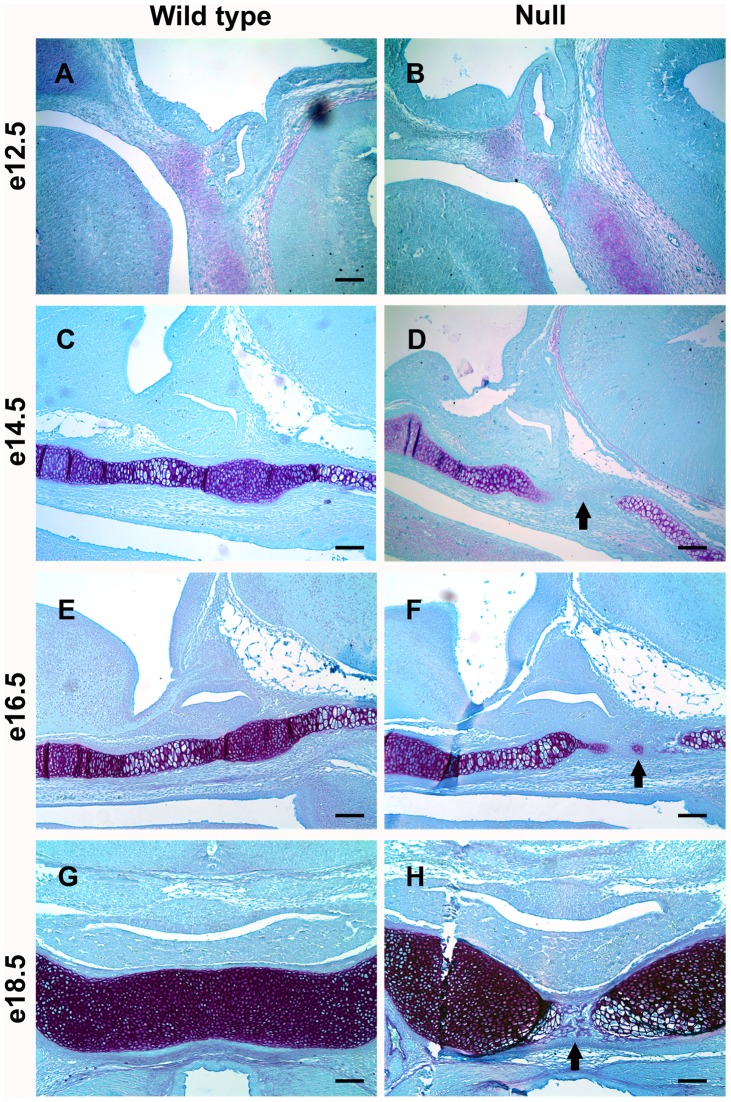
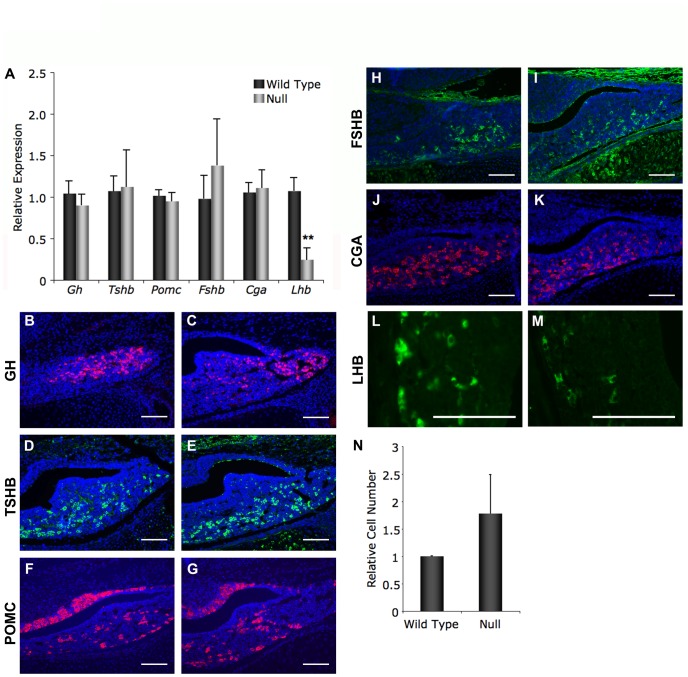
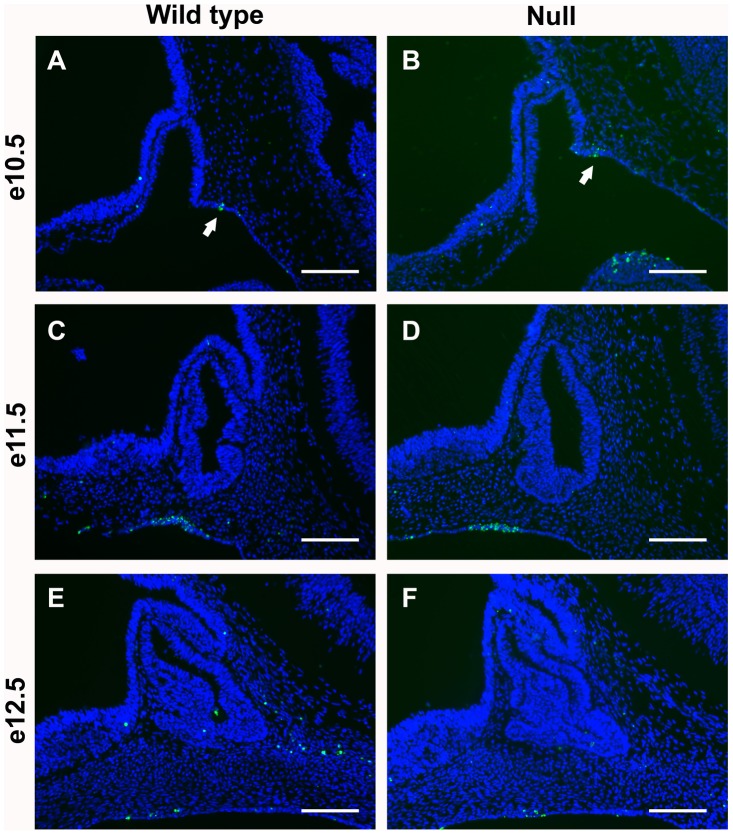
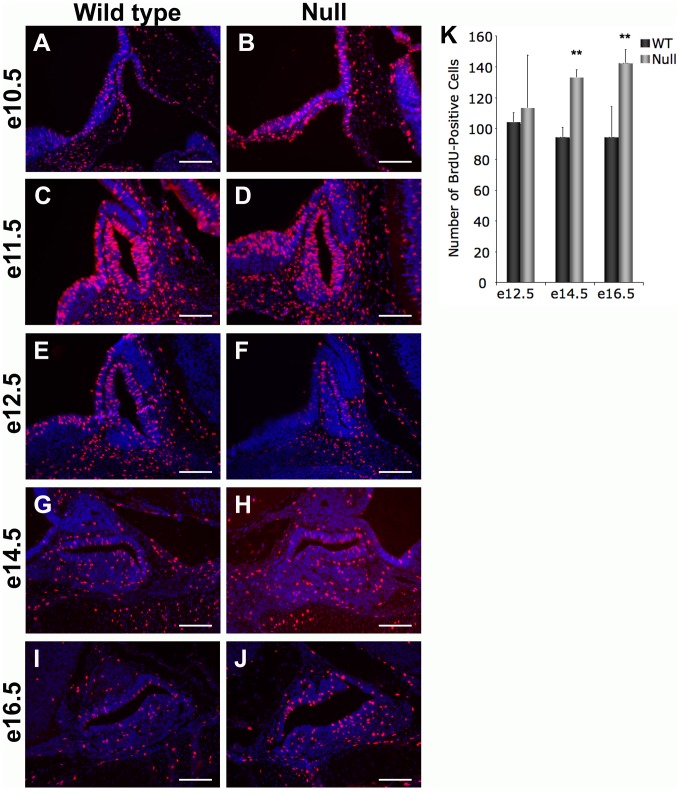
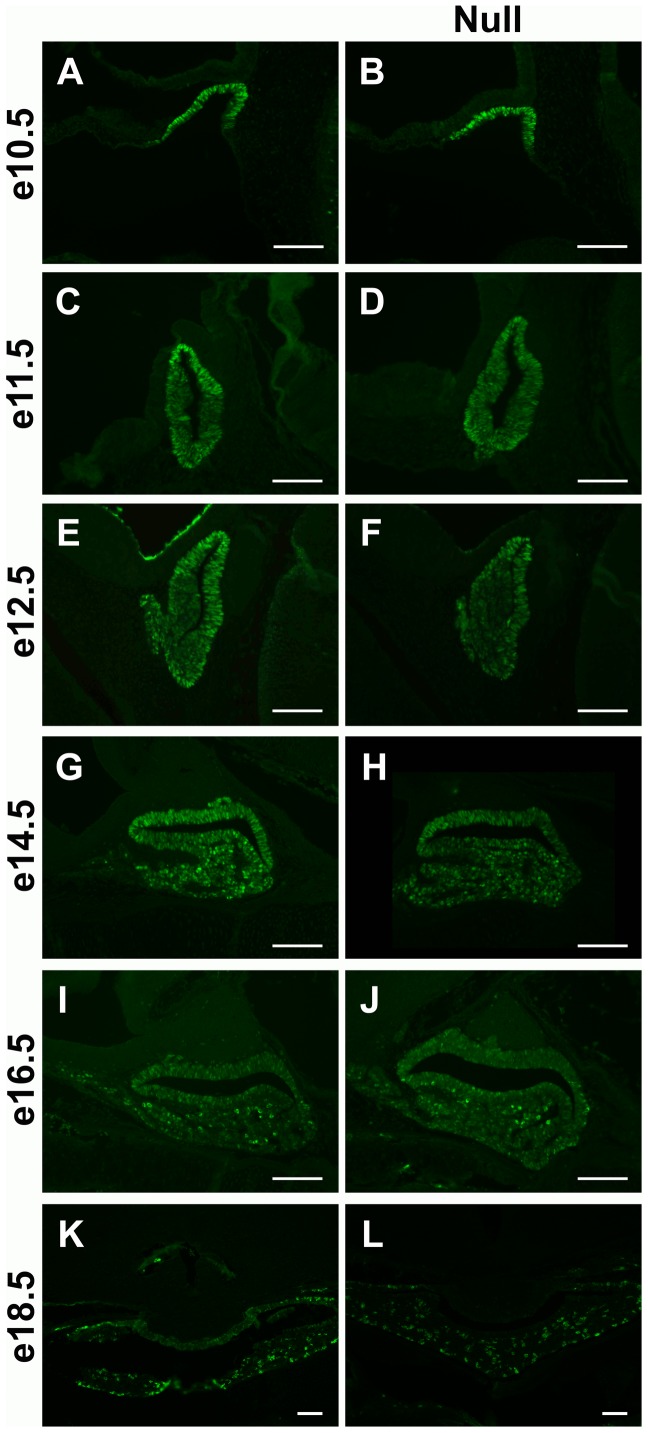
The pituitary gland regulates numerous physiological functions including growth, reproduction, temperature and metabolic homeostasis, lactation, and response to stress. Pituitary organogenesis is dependent on signaling factors that are produced in and around the developing pituitary. The studies described in this report reveal that the forkhead transcription factor, Foxd1, is not expressed in the developing mouse pituitary gland, but rather in the mesenchyme surrounding the pituitary gland, which is an essential source of signaling factors that regulate pituitary organogenesis. Loss of Foxd1 causes a morphological defect in which the anterior lobe of the pituitary gland protrudes through the cartilage plate that is developing ventral to the pituitary at embryonic days (e)14.5, e16.5, and e18.5. The number of proliferating pituitary cells is increased at e14.5 and e16.5. Loss of Foxd1 also results in significantly decreased levels of Lhb expression at e18.5. This decrease in Lhb expression does not appear to be due to a change in the number of gonadotrope cells in the pituitary gland. Previous studies have shown that loss of the LIM homeodomain factor, Lhx3, which is activated by the FGF signaling pathway, results in loss of LH production. Although there is a difference in Lhb expression in Foxd1 null mice, the expression pattern of LHX3 is not altered in Foxd1 null mice. These studies suggest that Foxd1 is indirectly required for normal Lhb expression and cartilage formation.
Conflict of interest statement
Figures
Similar articles
-
FOXO1 transcription factor inhibits luteinizing hormone β gene expression in pituitary gonadotrope cells.J Biol Chem. 2012 Sep 28;287(40):33424-35. doi: 10.1074/jbc.M112.362103. Epub 2012 Aug 3. J Biol Chem. 2012. PMID: 22865884 Free PMC article.
-
Cell-specific actions of a human LHX3 gene enhancer during pituitary and spinal cord development.Mol Endocrinol. 2013 Dec;27(12):2013-27. doi: 10.1210/me.2013-1161. Epub 2013 Oct 7. Mol Endocrinol. 2013. PMID: 24100213 Free PMC article.
-
FOXL2 in the pituitary: molecular, genetic, and developmental analysis.Mol Endocrinol. 2006 Nov;20(11):2796-805. doi: 10.1210/me.2005-0303. Epub 2006 Jul 13. Mol Endocrinol. 2006. PMID: 16840539
-
Embryonic development of gonadotrope cells and gonadotropic hormones--lessons from model fish.Mol Cell Endocrinol. 2014 Mar 25;385(1-2):18-27. doi: 10.1016/j.mce.2013.10.016. Epub 2013 Oct 18. Mol Cell Endocrinol. 2014. PMID: 24145126 Review.
-
Pituitary transcription factors in the aetiology of combined pituitary hormone deficiency.Best Pract Res Clin Endocrinol Metab. 2011 Feb;25(1):43-60. doi: 10.1016/j.beem.2010.10.014. Best Pract Res Clin Endocrinol Metab. 2011. PMID: 21396574 Review.
Cited by
-
FOXD1-ALDH1A3 Signaling Is a Determinant for the Self-Renewal and Tumorigenicity of Mesenchymal Glioma Stem Cells.Cancer Res. 2016 Dec 15;76(24):7219-7230. doi: 10.1158/0008-5472.CAN-15-2860. Epub 2016 Aug 28. Cancer Res. 2016. PMID: 27569208 Free PMC article.
-
LncRNA FOXD1-AS1 acts as a potential oncogenic biomarker in glioma.CNS Neurosci Ther. 2020 Jan;26(1):66-75. doi: 10.1111/cns.13152. Epub 2019 May 17. CNS Neurosci Ther. 2020. PMID: 31102349 Free PMC article.
-
Relationship between Pituitary Gland and Stem Cell in the Aspect of Hormone Production and Disease Prevention: A Narrative Review.Endocr Metab Immune Disord Drug Targets. 2025;25(7):509-526. doi: 10.2174/0118715303314551241031093717. Endocr Metab Immune Disord Drug Targets. 2025. PMID: 39812047 Review.
-
Variant-to-Gene-Mapping Analyses Reveal a Role for the Hypothalamus in Genetic Susceptibility to Inflammatory Bowel Disease.Cell Mol Gastroenterol Hepatol. 2021;11(3):667-682. doi: 10.1016/j.jcmgh.2020.10.004. Epub 2020 Oct 16. Cell Mol Gastroenterol Hepatol. 2021. PMID: 33069917 Free PMC article.
-
Regulation of pituitary stem cells by epithelial to mesenchymal transition events and signaling pathways.Mol Cell Endocrinol. 2017 Apr 15;445:14-26. doi: 10.1016/j.mce.2016.09.016. Epub 2016 Sep 17. Mol Cell Endocrinol. 2017. PMID: 27650955 Free PMC article. Review.
References
-
- Cushman LJ, Camper SA (2001) Molecular basis of pituitary dysfunction in mouse and human. Mamm Genome 12: 485–494. - PubMed
-
- Watkins-Chow DE, Camper SA (1998) How many homeobox genes does it take to make a pituitary gland? Trends Genet 14: 284–290. - PubMed
-
- Savage JJ, Yaden BC, Kiratipranon P, Rhodes SJ (2003) Transcriptional control during mammalian anterior pituitary development. Gene 319: 1–19. - PubMed
-
- Scully KM, Rosenfeld MG (2002) Pituitary development: regulatory codes in mammalian organogenesis. Science 295: 2231–2235. - PubMed
Publication types
MeSH terms
Substances
LinkOut - more resources
Full Text Sources
Molecular Biology Databases
