. 2012;7(12):e52329.
doi: 10.1371/journal.pone.0052329. Epub 2012 Dec 21.

The h-current in the substantia Nigra pars compacta neurons: a re-examination

Affiliations

The h-current in the substantia Nigra pars compacta neurons: a re-examination

Cristina Gambardella et al. PLoS One. 2012.

Abstract

The properties of the hyperpolarization-activated cation current (I(h)) were investigated in rat substantia nigra - pars compacta (SNc) principal neurons using patch-clamp recordings in thin slices. A reliable identification of single dopaminergic neurons was made possible by the use of a transgenic line of mice expressing eGFP under the tyrosine hydroxylase promoter. The effects of temperature and different protocols on the I(h) kinetics showed that, at 37°C and minimizing the disturbance of the intracellular milieu with perforated patch, this current actually activates at potentials more positive than what is generally indicated, with a half-activation potential of -77.05 mV and with a significant level of opening already at rest, thereby substantially contributing to the control of membrane potential, and ultimately playing a relevant function in the regulation of the cell excitability. The implications of the known influence of intracellular cAMP levels on I(h) amplitude and kinetics were examined. The direct application of neurotransmitters (DA, 5-HT and noradrenaline) physiologically released onto SNc neurons and known to act on metabotropic receptors coupled to the cAMP pathway modify the I(h) amplitude. Here, we show that direct activation of dopaminergic and of 5-HT receptors results in I(h) inhibition of SNc DA cells, whereas noradrenaline has the opposite effect. Together, these data suggest that the modulation of I(h) by endogenously released neurotransmitters acting on metabotropic receptors -mainly but not exclusively linked to the cAMP pathway- could contribute significantly to the control of SNc neuron excitability.


Conflict of interest statement

Competing Interests: The authors have declared that no competing interests exist.

Figures

Figure 1
Figure 1. Basic properties of the h-current at 37°C.
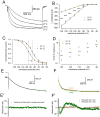
A: Response of a SNc DA neuron under current-clamp condition to the injection of a 300 pA hyperpolarizing current pulse. Note the appearance of the archetypal sag (arrow) due to the activation of Ih; resting potential −55 mV, bath solution for this recording was standard ACSF. B: Family of responses of a SN DA neuron under voltage-clamp conditions to the application of the double-pulse protocol shown in the inset above; explanation in the text. C: Current-voltage relationship of the h-current (□, right y-axis) and voltage-dependence of the activation curve (○, left y-axis) obtained from tail analysis of double-pulse experiments as shown in panel B; mean value ± S.E. (n = 20). D: Dependence of the midpoint (V50) on the duration of the hyperpolarizing pulse; the dashed line highlights the asymptotical behavior of the midpoint for a conditioning pulse of infinite duration - see text for explanation.
Figure 2
Figure 2. De-activation kinetics.
A: Envelope test during deactivation at −40 mV. After current activation at −130 mV, pulses to −40 mV of variable duration were followed by re-activating steps to −130 mV (see protocol in the top panel). B: The tail at −40 mV was also re-plotted after appropriate scaling (grey trace) to better compare its time course with that of the re-activation records envelope shown in panel A. C: Analysis of the deactivation time constant for a group of five cells; the average time dependence (dashed line) was fitted by the equation I(t) = 1–0.69*exp(-t/0.45) (dashed line; continuous line delimitate the 95% confidence interval).
Figure 3
Figure 3. Analysis of Ih reversal potential.
A: Response to hyperpolarizing steps from −40 to −130 mV using the indicated concentration of K+ ions in the external saline; T = 27°C. B,C: Recordings of the slow current relaxations recorded at holding potentials of −60 and −95 mV, respectively, in response to the indicated protocols represented in the insets of Figure D; T = 37°C. D: Instantaneous (chord) and ‘steady-state’ current-voltage relationships of a SNc DA neuron voltage-clamped at holding potentials of −60 mV (chord conductance 2.60 nS) and −90 mV (chord conductance 8.89 nS). Note that the chord conductance plots are approximately linear at both the holding potentials, despite the presence of strong inward rectification in the ‘steady-state’ current-voltage relationship measured at the end of 2 s hyperpolarizing voltage jumps from a holding potential of −60 mV. Inward rectification in the ‘steady-state’ current-voltage relationship is entirely accounted by these slow relaxations.
Figure 4
Figure 4. Effect of temperature on h-current amplitude and kinetics.
A: Family of current tracings recorded in a single cell in response to hyperpolarizing pulses from −40 to −130 mV, repeated at the temperatures indicated. B: Comparison of the I/V curves recorded at 27 (yellow dots) and 37°C (orange dots); n = 20; the difference, tested with two-way ANOVA and post-hoc Bonferroni test, is significant at 0.001 level for the potentials more negative than −70 mV. C: Shift of the steady-state activation curves for a change from 27°C (yellow) to 37°C (orange), average values from 13 cells ± S.E for the V50. D: Effect of the temperature on the h-current 10–90% risetime at 27°C (yellow) and 37°C (orange); see explanation in the text. E, E′: Sample fit with a single exponential of an h-current tracing obtained at 27°C in response to a voltage step to −130 mV; below the analysis of the residuals (experimental data minus the corresponding values of the fitting curve). F, F′: Sample fit with both single (green) and double (orange) exponential of a h-current tracing obtained at 37°C in response to a voltage step to −130 mV; below the analysis of the residuals in the same grey scale code. All the recordings shown in this figure were obtained in perforated patch conditions.
Figure 5
Figure 5. Basic pharmacology of h-current.
A: Blockage by Cs+ (1 mM): current-clamp responses to a repeated hyperpolarizing current step of 300 pA from a holding potential of −60 mV. Note the progressive suppression of the sag after the indicated times of Cs+ application; T 37°C. B: Blockage by ivabradine (10 µM): voltage clamp responses to a repeated hyperpolarizing step to −130 mV from a holding potential of −40 mV at the indicated times of drug application; T 37°C. C: Blockage by ZD7288 (30 µM); holding potential −40 mV, test potentials ranging from −70 to −130 mV; T 27°C, Ba2+0.5 mM present throughout.
Figure 6
Figure 6. Role of Ih in autorhythmicity.
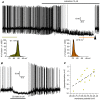
A: Current-clamp recording (perforated patch, 37°C) showing the hyperpolarizing effect of a selective, non voltage-dependent blocker of the h-current (ivabradine 10 µM, applied focally at the moment indicated by the arrow) on spontaneous activity. The two insets below illustrate the method used for the determination of the “resting” membrane potential in spontaneously active cells: the value was actually measured as the prevailing potential, measured by fitting a Gaussian to the membrane potential values in the time intervals marked by the bars of the same color. At the time marked by the large arrow to the right, the membrane was manually depolarized to the value antecedent the ivabradine application, restoring the spontaneous activity and thereby showing that the h-current is not essential for the pacemaking mechanism. B: Same experiment using ZD7288 30 µM. C: Relationship of the hyperpolarizing effects obtained with ZD7288 with the resting membrane potential, showing a significant correlation (p<0.02; ANOVA).
Figure 7
Figure 7. Effect of an increase of intracellular cAMP stimulated by forskolin on h-current.
A: Effect of forskolin (10 µM) alone (yellow) and in association with IBMX (0.1 mM, orange) on resting membrane potential; explanation in the text. B: I/V relationship of the h-current in control conditions (green) and in the presence of forskolin+IBMX (blue); two-way ANOVA and Bonferroni post-hoc test: * indicates P<0.01, **P<0.001. C: Effect of forskolin+IBMX on steady-state activation curve. The shift of the midpoint in the depolarizing direction (6.33±0.68 mV, n = 8) is significant at the 0.0005 level. D: effect of forskolin+IBMX on the 10–90% activation rise time of the h-current; two-way repeated measures ANOVA and Bonferroni post-hoc test: * indicates P<0.05, **P<0.01 and ***P<0.001. All the experiments shown were performed at 37°C.
Figure 8
Figure 8. Sample tracings showing the effect of different neurotransmitters on the h-current; responses to hyperpolarizations to −130 mV from a holding potential of −40 mV; perforated patches, 37°C.
The external saline included TTX, 4AP, TEA and Ba2+. A: Effects of the D2 agonist quinpirole (30 µM) and of the D2 antagonist sulpiride (20 µM); note that in the presence of the antagonist the response is greater than controls. B: Effect of 5-HT (100 µM). C: Effect of NA (100 µM). D: Time constant of the development of the effects of quinpirole and 5-HT.

Similar articles

Cited by

References

    1. Grace AA, Onn SP (1989) Morphology and electrophysiological properties of immunocytochemically identified rat dopamine neurons recorded in vitro. J Neurosci 9: 3463–3481. - PMC - PubMed
    1. Ford CP, Mark GP, Williams JT (2006) Properties and opioid inhibition of mesolimbic dopamine neurons vary according to target location. J Neurosci 26: 2788–2797. - PMC - PubMed
    1. Klink R, de Kerchove dA, Zoli M, Changeux JP (2001) Molecular and physiological diversity of nicotinic acetylcholine receptors in the midbrain dopaminergic nuclei. J Neurosci 21: 1452–1463. - PMC - PubMed
    1. Korotkova TM, Ponomarenko AA, Brown RE, Haas HL (2004) Functional diversity of ventral midbrain dopamine and GABAergic neurons. Mol Neurobiol 29: 243–259. - PubMed
    1. Labouebe G, Lomazzi M, Cruz HG, Creton C, Lujan R, et al. (2007) RGS2 modulates coupling between GABAB receptors and GIRK channels in dopamine neurons of the ventral tegmental area. Nat Neurosci 10: 1559–1568. - PubMed

Publication types