. 2012;7(12):e52338.
doi: 10.1371/journal.pone.0052338. Epub 2012 Dec 17.

Neurotrophin gene therapy for sustained neural preservation after deafness

Affiliations

Neurotrophin gene therapy for sustained neural preservation after deafness

Patrick J Atkinson et al. PLoS One. 2012.

Abstract

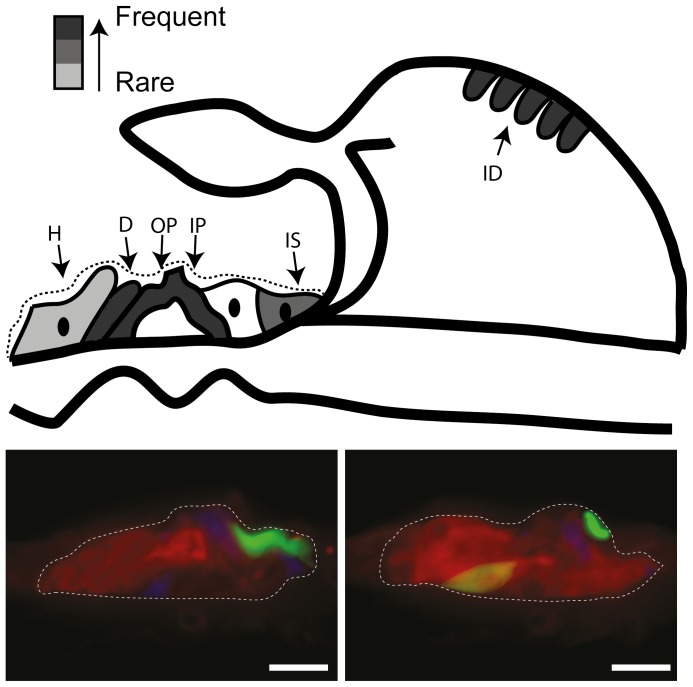
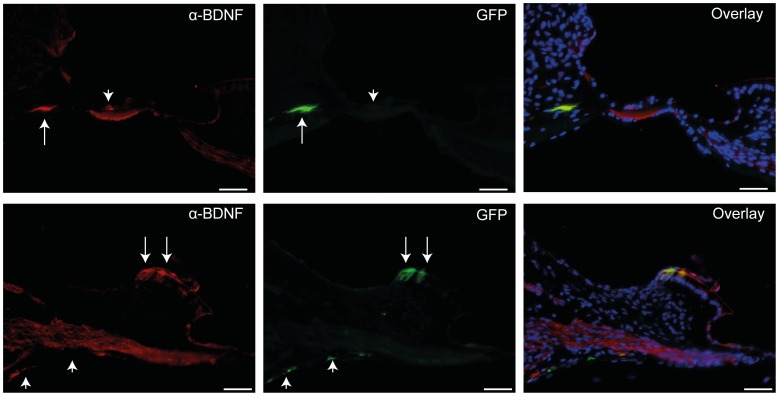
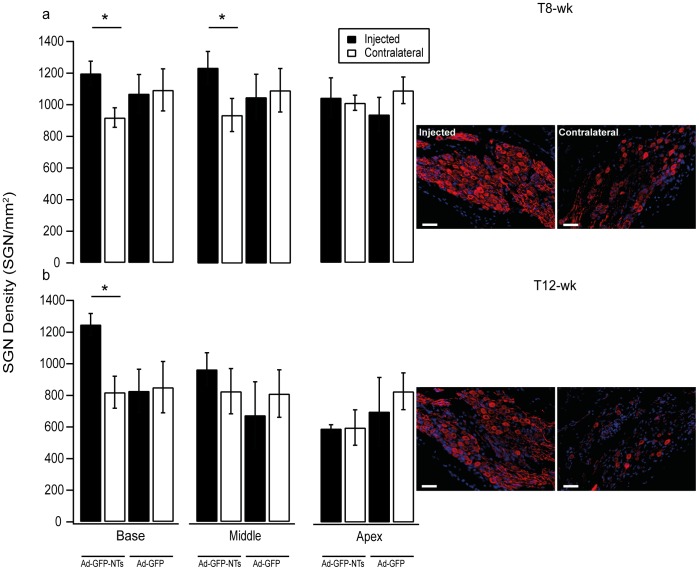
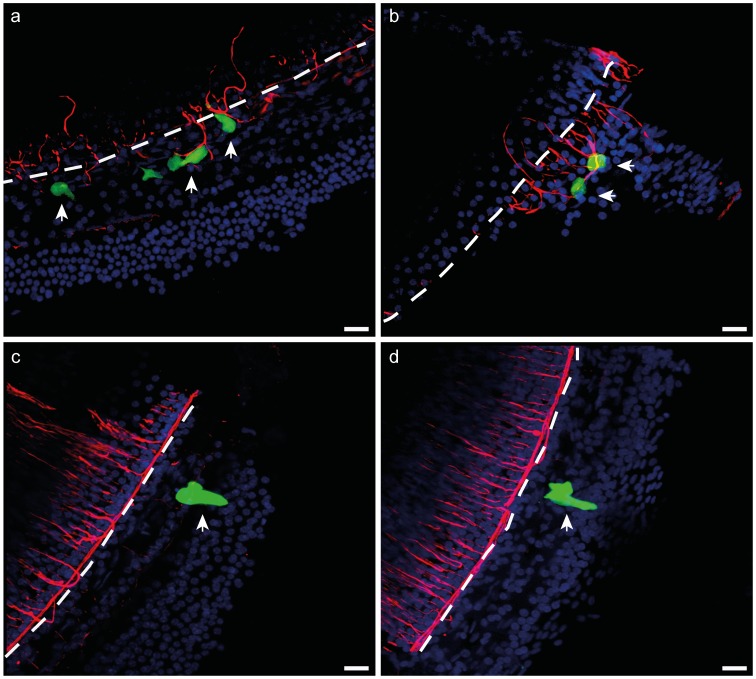
The cochlear implant provides auditory cues to profoundly deaf patients by electrically stimulating the residual spiral ganglion neurons. These neurons, however, undergo progressive degeneration after hearing loss, marked initially by peripheral fibre retraction and ultimately culminating in cell death. This research aims to use gene therapy techniques to both hold and reverse this degeneration by providing a sustained and localised source of neurotrophins to the deafened cochlea. Adenoviral vectors containing green fluorescent protein, with or without neurotrophin-3 and brain derived neurotrophic factor, were injected into the lower basal turn of scala media of guinea pigs ototoxically deafened one week prior to intervention. This single injection resulted in localised and sustained gene expression, principally in the supporting cells within the organ of Corti. Guinea pigs treated with adenoviral neurotrophin-gene therapy had greater neuronal survival compared to contralateral non-treated cochleae when examined at 7 and 11 weeks post injection. Moreover; there was evidence of directed peripheral fibre regrowth towards cells expressing neurotrophin genes after both treatment periods. These data suggest that neurotrophin-gene therapy can provide sustained protection of spiral ganglion neurons and peripheral fibres after hearing loss.


Conflict of interest statement

Competing Interests: The authors have declared that no competing interests exist.

Figures

Figure 1
Figure 1. Degeneration of the OC post aminoglycoside deafening.
The OC (outlined by black dashed box) degenerated rapidly in the basal turn after aminoglycoside deafening in the GP as illustrated in the representative photomicrographs of the upper basal turn at various time points post deafening. There was a significant difference between the OC area of normal hearing GPs and all other cohorts (#p<0.001, ANOVA). This indicates that even after 1 week significant degeneration had occurred. There is also a significant difference between 1 week and 8 and 12 weeks post deafening (*p<0.001, ANOVA), however, there was no further change after between 8 and 12 weeks. There was no difference in the time course of degeneration between left (NT-treated) cochleae and right (non-treated cochleae). These data gives an indication of the status of the OC at the time of gene therapy intervention (1 Wk Deaf) and at the times of analysis (8 Wk and 12 Wk Deaf). Error bars indicate the standard error of the mean (n = 4–5 GPs per point). Scale bars = 20 µm.
Figure 2
Figure 2. Schematic and photomicrographs of GFP expression in the deafened GP cochlea.
Injection of Ad-GFP or Ad-GFP-NTs into the SM when examined after at T12-wk (n = 9) resulted in GFP expression in the OC and interdental cells of the spiral limbus of the lower basal and upper basal turns (represented by greyscale coded schematic, with dark grey representing areas where GFP expression was frequently observed (n>5) and light grey representing areas where GFP expression was only rarely observed (n<2). Photomicrographs illustrate GFP expression (green), in the OC, specifically the inner and outer pillar cells (IP, OP), along with Deiters’ (D), Hensen’s (H) cells, inner sulcus cells (IS) and the interdental cells (ID) of the spiral limbus. Sections are co-labelled with anti-calretinin (red) and phalloidin (blue). Scale bars = 20 µm.
Figure 3
Figure 3. BDNF expression in deafened GPs injected with Ad-GFP-NT at 11 weeks.
Two examples (top and bottom) showing anti-BDNF antibody staining (red) co-localised with GFP expression (green) in some (arrows), but not all cases (arrowheads). As GPs were injected with a combination of vectors encoding for BDNF and NT3, not every GFP-positive cell would be expected to co-localise with BDNF staining, as illustrated in overlays above. Scale bars = 50 µm.
Figure 4
Figure 4. SGN density measurements in treated and untreated cochleae of deafened GPs.
SGN density data for deafened cochleae injected with either NTs or GFP control vector and the untreated control cochlea (contralateral) following 7 (a) or 11 (b) weeks treatment. Example photomicrographs of SGNs in the lower basal turn for 7 and 11 week groups that received Ad-GFP-NTs in the injected cochlea. After 7 weeks of treatment there was a significantly greater SGN density in the basal and middle turns of the cochlea (*p<0.05, ANOVA). When examined at 11 weeks post injection there was also significantly greater SGN density in the basal turn of the cochlea (*p<0.05, ANOVA). Error bars indicate the standard error of the mean (n = 4–5 GPs per point). Scale bar = 50 µm.
Figure 5
Figure 5. Peripheral fibres growing proximal to Ad-GFP-NTs transduced cells.
Cochlear surface preps were stained with anti-NF200 (red) and DAPI (blue). (a–b) Peripheral fibres response to neurotrophin-expressing cells (arrows) in the OC 11 weeks post Ad-GFP-NTs treatment. (c–d) Peripheral fibre response to cells expressing GFP only (arrows) in the OC 11 weeks post Ad-GFP injection. Significantly greater densities of fibres were observed around NT-secreting cells compared to GFP-only transduced cells (p<0.05, t-test). The dotted line indicates the inner edge, the approximate site of the inner pillar cells of the OC. Scale bar = 50 µm.
Figure 6
Figure 6. ABR threshold shifts in normal hearing GPs following viral injection.
Shifts in ABR thresholds were observed in normal-hearing GPs following injection with Ad-GFP. ABRs were measured at 1 week pre-injection and at 11 weeks post-injection. Significant threshold shifts were observed at the higher frequencies (16–32 kHz) (*p<0.05 paired t-test), the region at which the injection was made. Error bars represent standard error of the mean (n = 5 GPs per bar).
Figure 7
Figure 7. Histological sections showing an example of tissue response in the lower basal turn.
Examples of cochlear cross sections illustrate the location and extent of tissue response (arrows) characterised by fibrosis and minimal new bone growth in the lower basal turn of the cochlea associated with viral injection surgery. The tissue response was localised to the basal turn scala tympani (ST) with only a very minor response observed in the scala media (zoomed image). Scale bar = 200 µm, and 50 µm on zoomed imaged.

References

    1. Davis AC (1990) Epidemiological profile of hearing impairments: the scale and nature of the problem with special reference to the elderly. Acta Otolaryngol Suppl 476: 23–31. - PubMed
    1. Wilson D, Walsh P, Sanchez L, Davis A, Taylor A, et al. (1999) The epidemiology of hearing impairment in an Australian adult population. Int J Epidemiol 28: 247–252. - PubMed
    1. Clark GM (2003) Cochlear implants: fundamentals and applications Graeme Clark. New York: Springer.
    1. Bichler E, Spoendlin H, Rauchegger H (1983) Degeneration of cochlear neurons after amikacin intoxication in the rat. Arch Otorhinolaryngol 237: 201–208. - PubMed
    1. Dodson HC, Mohuiddin A (2000) Response of spiral ganglion neurones to cochlear hair cell destruction in the guinea pig. J Neurocytol 29: 525–537. - PubMed

Publication types

Substances