. 2012;7(12):e52389.
doi: 10.1371/journal.pone.0052389. Epub 2012 Dec 20.

Methylene blue reduced abnormal tau accumulation in P301L tau transgenic mice

Affiliations

Methylene blue reduced abnormal tau accumulation in P301L tau transgenic mice

Masato Hosokawa et al. PLoS One. 2012.

Abstract

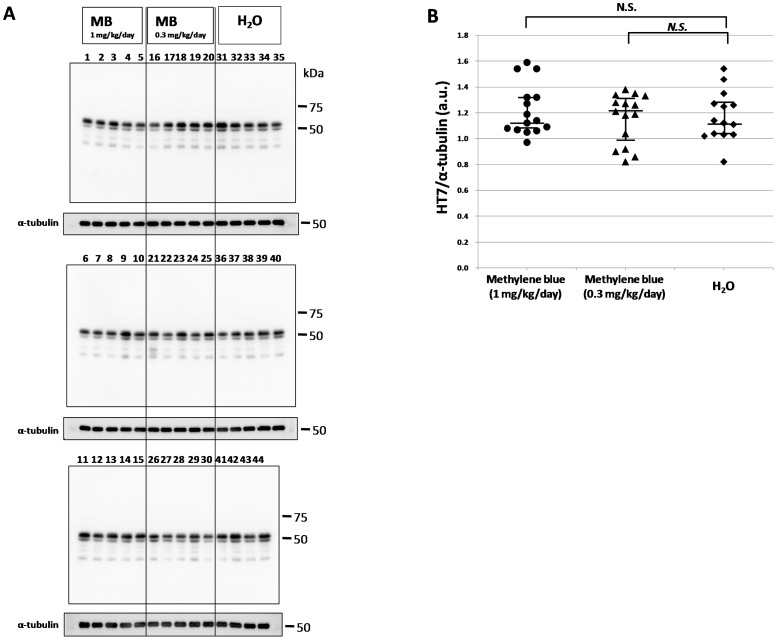
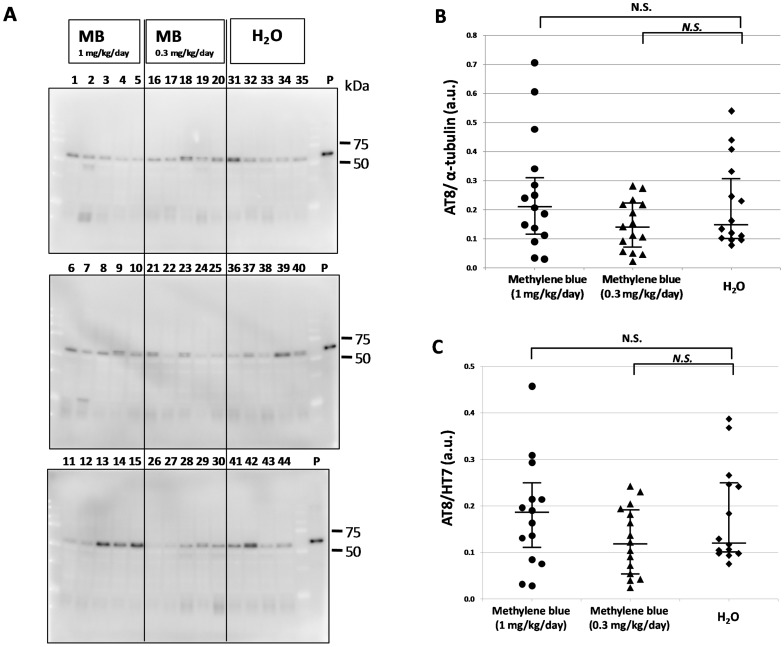
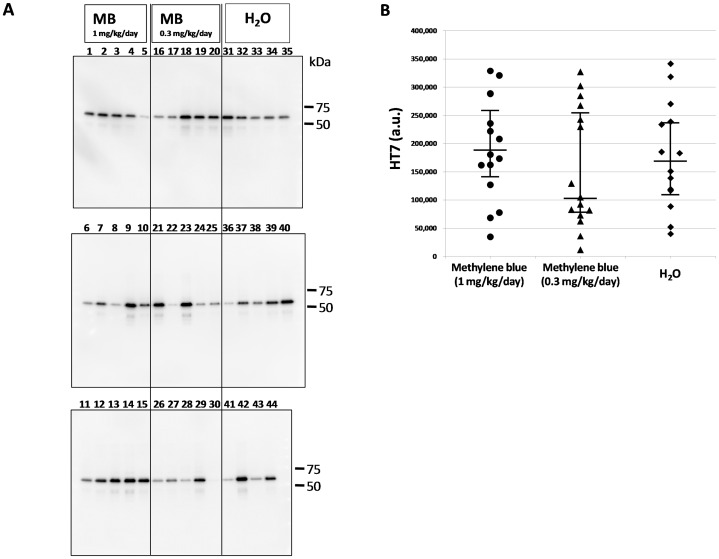
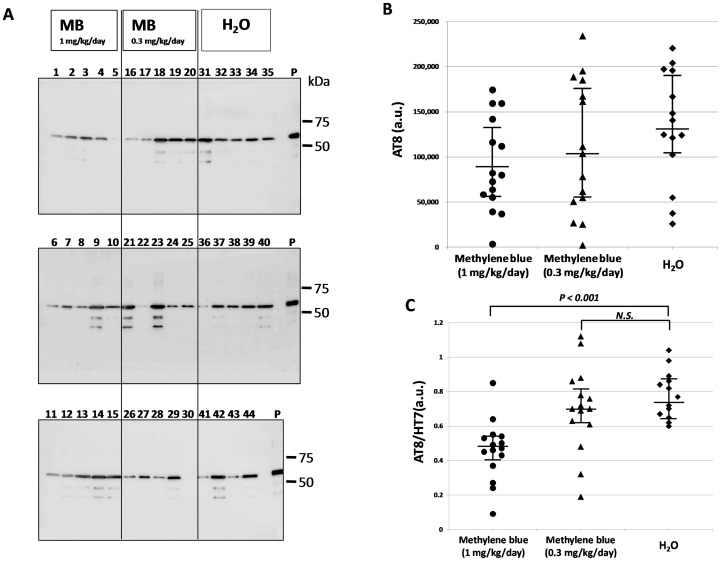
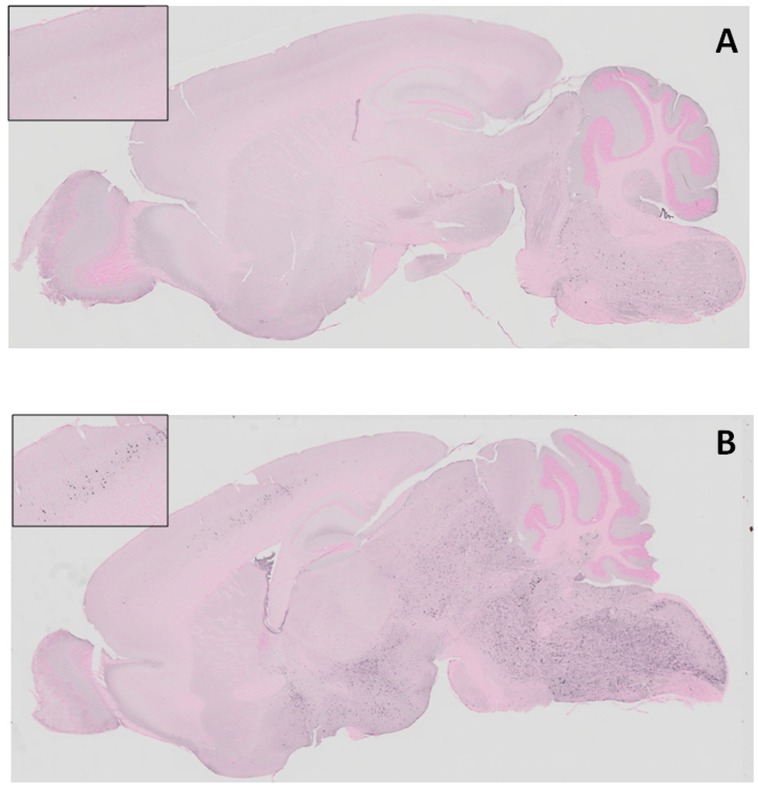
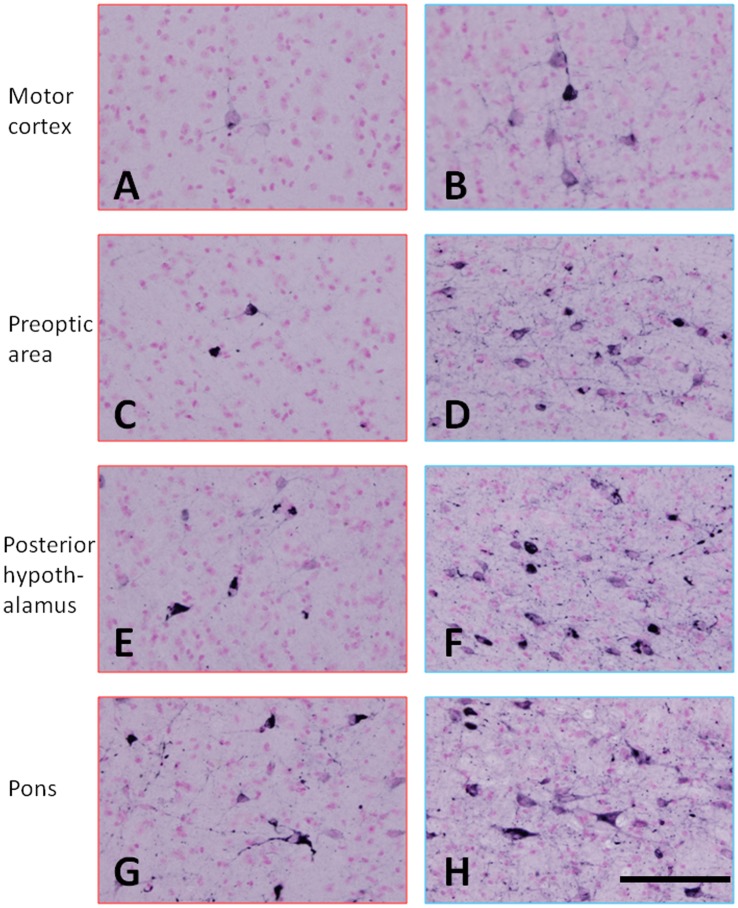
In neurodegenerative disorders, abnormally hyperphosphorylated and aggregated tau accumulates intracellularly, a mechanism which is thought to induce neuronal cell death. Methylene blue, a type of phenothiazine, has been reported to inhibit tau aggregation in vitro. However, the effect of methylene blue in vivo has remained unknown. Therefore, we examined whether methylene blue suppresses abnormal tau accumulation using P301L tau transgenic mice. At 8 to 11 months of age, these mice were orally administered methylene blue for 5 months. Subsequent results of Western blotting analysis revealed that this agent reduced detergent-insoluble phospho-tau. Methylene blue may have potential as a drug candidate for the treatment of tauopathy.


Conflict of interest statement

Competing Interests: The authors have declared that no competing interests exist.

Figures

Figure 1
Figure 1. Immunoblotting analysis of total tau in the Tris-soluble fraction.
(A) Immunoblotting analysis was visualized using HT7 antibody for the Tris-soluble fraction. The numbers indicate individual mice: 1–15, MB 1 mg/kg/day group; 16–30, MB 0.3 mg/kg/day group; and 31–44, water only group. Molecular weight markers are shown on the right (kDa). For quantitative measure of band intensity, α-tubulin was used as an internal control for protein concentration. (B) A comparison of the relative total tau (HT7) expression levels of the MB-treated groups and the water only group. The data were compared with the HT7 band intensity, which was normalized with α-tubulin. The central lines indicate medians and the vertical lines represent 25th and 75th percentiles. a.u., arbitrary unit. N.S., no significant difference.
Figure 2
Figure 2. Immunoblotting analysis of phosphorylated tau in the Tris-soluble fraction.
(A) Immunoblot analysis was visualized using AT8 antibody for the Tris-soluble fraction. The numbers indicate individual mice: 1–15, MB 1 mg/kg/day group; 16–30, MB 0.3 mg/kg/day group; and 31–44, water only group. Molecular weight markers are shown on the right (kDa). P, positive control (P301L tau transgenic mouse, 20 month-old female). (B) A comparison of relative phosphorylated tau (AT8) expression levels of the MB-treated groups and the water only group. The data were compared with the AT8 band intensity, which was normalized with α-tubulin. (C) A comparison of the relative phosphorylated tau (AT8)/total tau (HT7) levels of the MB-treated groups and the water only group. The data were compared with the AT8 band intensity, which was normalized with the total tau (HT7) band intensity. The central lines indicate medians and the vertical lines represent 25th and 75th percentiles. a.u., arbitrary unit. N.S., no significant difference.
Figure 3
Figure 3. Immunoblotting analysis of total tau in the sarkosyl-insoluble fraction.
(A) Immunoblot analysis was visualized using HT7 antibody for the sarkosyl-insoluble fraction. The numbers indicate individual mice: 1–15, MB 1 mg/kg/day group; 16–30, MB 0.3 mg/kg/day group; 31–44, water only group. Molecular weight markers are shown on the right (kDa). (B) A comparison of relative total tau (HT7) expression levels in the sarkosyl-insoluble fraction of the MB-treated groups and the water only group. The data were compared with the HT7 band intensity. The central lines indicate medians and the vertical lines represent 25th and 75th percentiles. a.u., arbitrary unit.
Figure 4
Figure 4. Immunoblotting analysis of abnormal tau in the sarkosyl-insoluble fraction.
(A) Immunoblotting analysis was visualized using AT8 antibody for the sarkosyl-insoluble fraction. The numbers indicate individual mice: 1–15, MB 1 mg/kg/day group; 16–30, MB 0.3 mg/kg/day group; and 31–44, water only group. Molecular weight markers are shown on the right (kDa). P, positive control (P301L tau transgenic mouse, 20 month-old female). (B) A comparison of relative AT8 expression levels of the MB-treated groups and the water only group. The data were compared with the AT8 band intensity. (C) A comparison of relative phosphorylated tau (AT8)/total tau (HT7) levels of the MB-treated groups and the water only group. The data were compared with the AT8 band intensity, which was normalized with the total tau (HT7) band intensity. The central lines indicate medians and the vertical lines represent 25th and 75th percentiles. P<0.01 was considered to represent a statistically significant difference. a.u., arbitrary unit. N.S., no significant difference.
Figure 5
Figure 5. Immunohistochemical staining of abnormal tau.
(A) An AT8 immunoreaction was observed only in spinal cord, medulla oblongata and pons of a mouse with a low AT8/HT7 ratio. (B) AT8-positive cells were seen in spinal cord, medulla oblongata, pons, midbrain, hypothalamus and cerebral cortex of a mouse with a high AT8/HT7 ratio. Each insert shows the cerebral cortex of the mouse brain.
Figure 6
Figure 6. Immunohistochemical staining with a conformational antibody that recognizes aggregated tau.
MC-1-positive neurons and cellular processes were seen in the motor cortex (A and B), prepotic area (C and D), posterior hypothalamus (E and F) and pons (G and H). A, C, E, G, mouse with a low AT8/HT7 ratio; and B, D, F, H, mouse with a high AT8/HT7 ratio. The calibration bar in H applies to all photomicrographs (50 µm).

References

    1. Wischik CM, Edwards PC, Lai RY, Roth M, Harrington CR (1996) Selective inhibition of Alzheimer disease-like tau aggregation by phenothiazines. Proc Natl Acad Sci U S A 93: 11213–11218. - PMC - PubMed
    1. Taniguchi S, Suzuki N, Masuda M, Hisanaga S, Iwatsubo T, et al. (2005) Inhibition of heparin-induced tau filament formation by phenothiazines, polyphenols, and porphyrins. J Biol Chem 280: 7614–7623. - PubMed
    1. Wischik CM, Bentham P, Wischik DJ, Seng KM (2008) Tau aggregation inhibitor (TAI) therapy with Rember arrests disease progression in mild and moderate Alzheimer's disease over 50 weeks. Alzheimer's & Dementia 8: T167.
    1. Gravitz L (2011) Drugs: a tangled web of targets. Nature 475: S9–11. - PubMed
    1. van Bebber F, Paquet D, Hruscha A, Schmid B, Haass C (2010) Methylene blue fails to inhibit Tau and polyglutamine protein dependent toxicity in zebrafish. Neurobiol Dis 39: 265–271. - PubMed

Publication types

MeSH terms