. 2012;7(12):e52580.
doi: 10.1371/journal.pone.0052580. Epub 2012 Dec 20.

Analysis of suppressor and non-suppressor FOXP3+ T cells in HIV-1-infected patients

Affiliations

Analysis of suppressor and non-suppressor FOXP3+ T cells in HIV-1-infected patients

Lourdes Arruvito et al. PLoS One. 2012.

Abstract

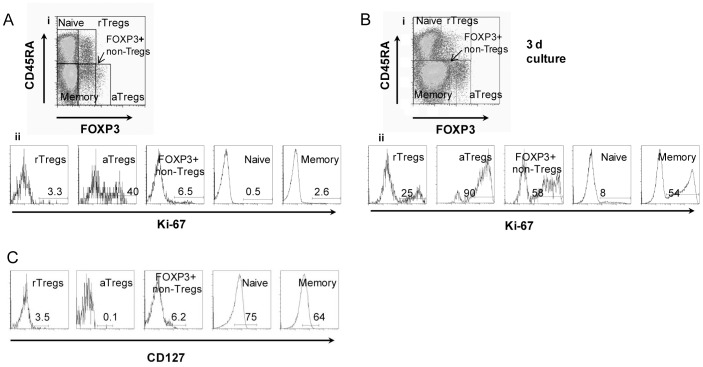
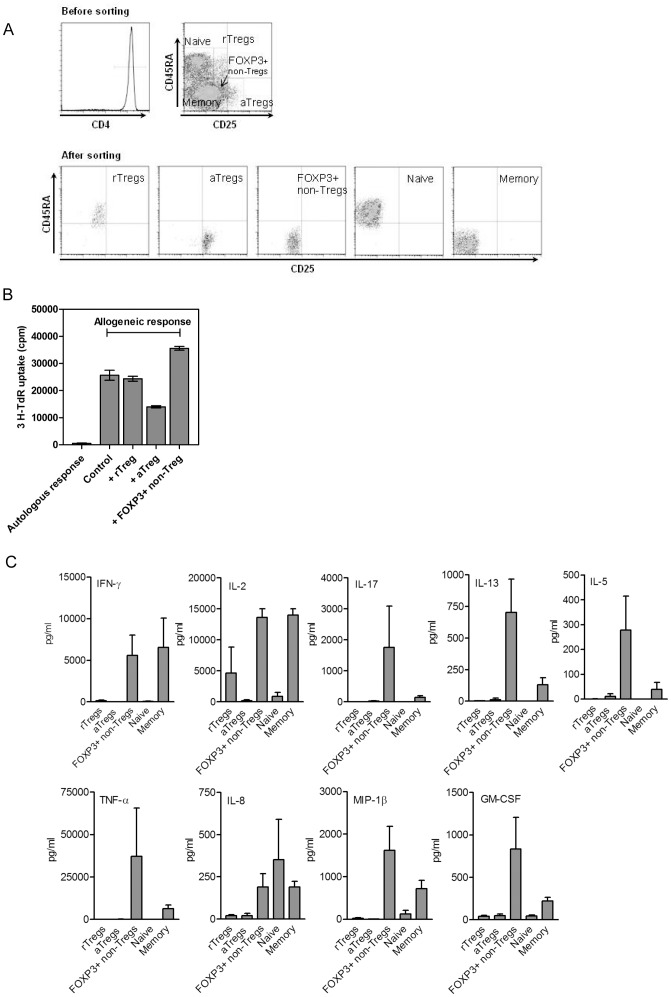
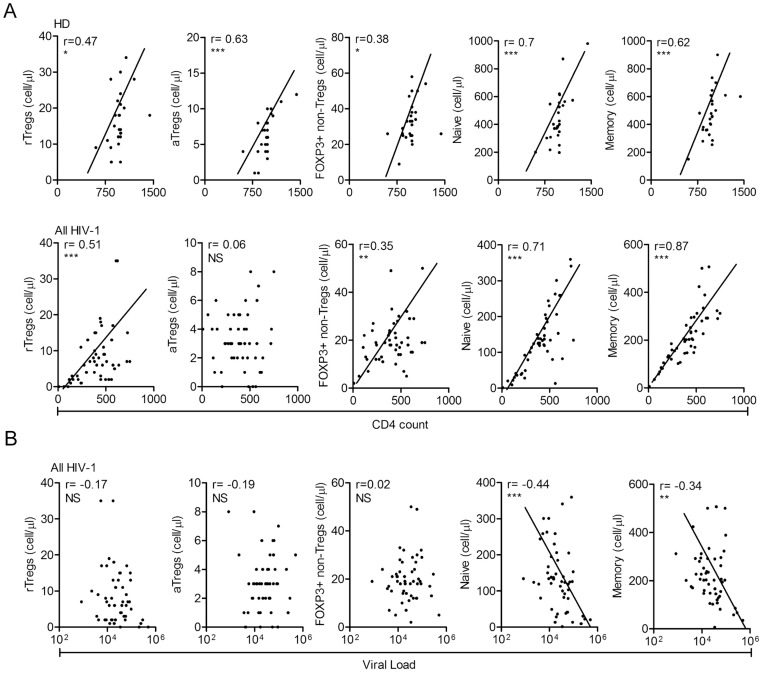
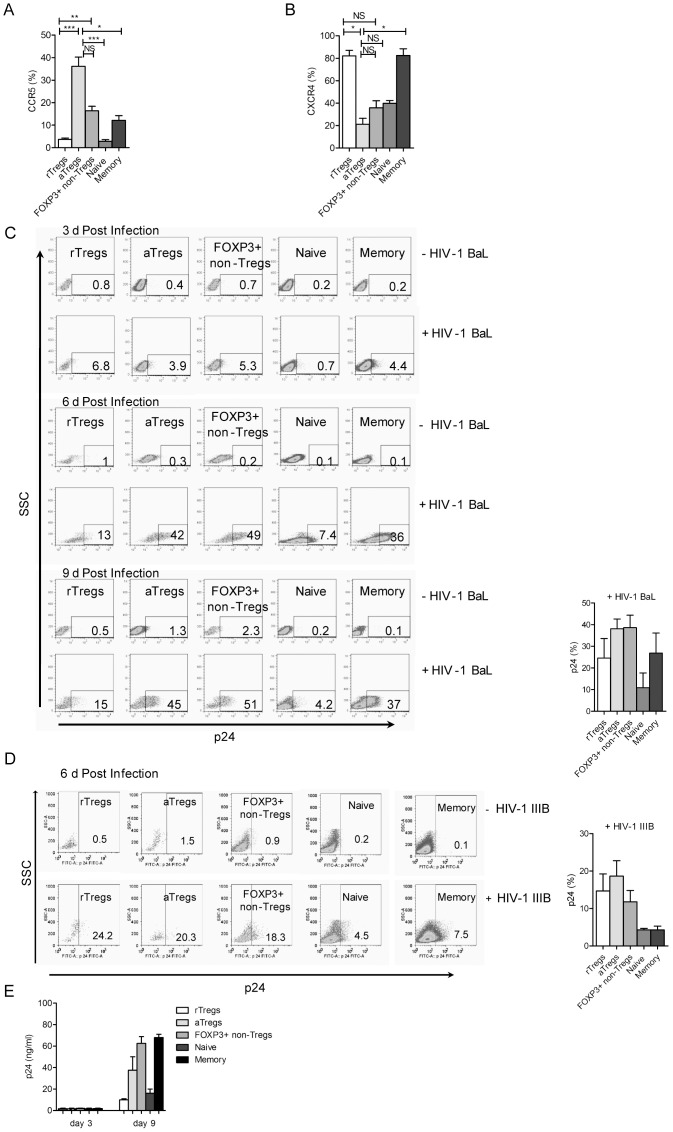
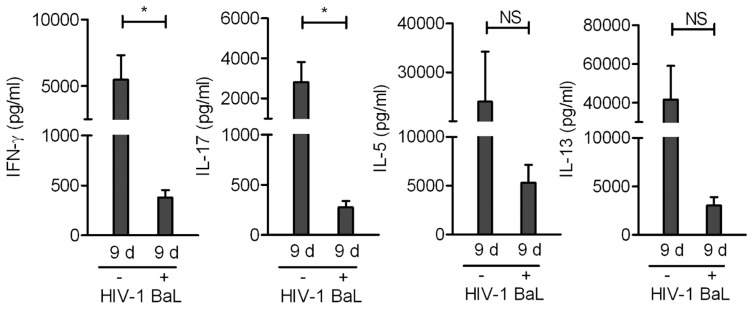
Recently, it was shown that peripheral blood FOXP3+CD4+ T cells are composed of three phenotypic and functionally distinct subpopulations. Two of them having in vitro suppressive effects were characterized as resting Treg cells (rTregs) and activated Treg cells (aTregs). A third subset, identified as FOXP3+ non-Tregs, does not display any suppressor activity and produce high levels of Th1 and Th17 cytokines upon stimulation. In the present study we focus on the characteristics of these three subsets of FOXP3+CD4+ T cells in untreated HIV-1-infected patients. We found that the absolute counts of rTregs, aTregs and FOXP3+ non-Tregs were reduced in HIV-1 patients compared with healthy donors. The relative frequency of rTregs and aTregs was similar in HIV-1 patients and healthy donors, while the frequency of FOXP3+ non-Tregs was significantly higher in HIV-1 patients, reaching a maximum in those patients with the lower values of CD4 counts. Contrasting with the observations made in FOXP3- CD4+ T cells, we did not find a negative correlation between the number of rTregs, aTregs or FOXP3+ non-Tregs and virus load. Studies performed with either whole PBMCs or sorted aTregs and FOXP3+ non-Tregs cells showed that these two populations of FOXP3+ T cells were highly permissive to HIV-1 infection. Upon infection, FOXP3+ non-Tregs markedly down-regulates its capacity to produce Th1 and Th17 cytokines, however, they retain the ability to produce substantial amounts of Th2 cytokines. This suggests that FOXP3+ non-Tregs might contribute to the polarization of CD4+ T cells into a Th2 profile, predictive of a poor outcome of HIV-1-infected patients.


Conflict of interest statement

Competing Interests: The authors have declared that no competing interests exist.

Figures

Figure 1
Figure 1. Identification of rTregs, aTregs, and FOXP3+ non-Tregs in healthy donors by flow cytometry. Ai.
Based on the expression of CD45RA and FOXP3, five subsets of CD4+T cells are defined: FOXP3lowCD45RA+ (rTregs), FOXP3highCD45RA- (aTregs), FOXP3lowCD45RA- (FOXP3+ non-Tregs), FOXP3-CD45RA+ (naive T cells) and FOXP3-CD45RA- (memory T cells). Representative dot plots of CD45RA and FOXP3 expression on CD4+ T cells performed on PBMCs (n = 27) Aii. Representative histograms showing the expression of the proliferation marker Ki-67 for each cellular population defined in Ai. Bi. Representative dot plot of CD45RA and FOXP3 expression on CD4+ T cells performed on PBMCs activated during three days by using anti-CD3/CD28 antibodies. Bii. Representative histograms showing the expression of the proliferation marker Ki-67 for each cell population, after activation during three days with anti-CD3/CD28 antibodies. C. Histograms showing the expression of CD127 for each cellular subset. Aii, Bi, Bii, and C: data are representative of six independent experiments.
Figure 2
Figure 2. Functional characterization of FOXP3+ T cells in healthy donors.
A. Cell sorting strategy to isolate rTregs, aTregs, FOXP3+ non-Tregs, naive and memory T cells as live cells. Top Panel. A representative histogram showing purified CD4+ T cells isolated from a healthy donor by negative selection. Cells were stained before sorting with anti-CD4, anti-CD25 and anti-CD45RA antibodies. rTreg cells were identified as CD25lowCD45RA+, aTreg cells as CD25highCD45RA-, FOXP3+ non-Tregs as CD25lowCD45RA-, naive T cells as CD25-CD45RA+ and memory T cells as CD25-CD45RA-. Bottom panel. Dot plots of each cellular subset after sorting. The purity of the sorted populations was >98% in all the experiments. The expression of FOXP3 in sorted cells was detected in >90% of aTregs and >80% of either rTregs or FOXP3+ non-Tregs. Only a marginal expression of FOXP3 (<0.5%) was observed in conventional naive and memory T cells. B. The ability of each population of FOXP3+ T cells to suppress the mixed lymphocyte reaction was assessed as described in Materials and Methods. Autologous response or allogeneic responses without the addition of isolated FOXP3+ T cells are included as controls. A representative experiment (n = 3) is shown. C. Determination of the levels of cytokines and chemokines secreted by each activated T cell subset by the Bioplex system. rTregs, aTregs, FOXP3+ non-Tregs, naive and memory T cells were purified from PBMCs by cell sorting. Then, they were stimulated by PMA/ionomycin for 5 h, and the supernatants were harvested. The results are expressed as the mean ± SEM of six independent experiments.
Figure 3
Figure 3. Analysis of the correlation between each T cell subset and the total counts of CD4+ T cells or the virus load. A.
A positive correlation between the absolute number of CD4+ T cells and the absolute number of each T cell subset is observed in both HD and HIV-1 patients, except in the aTreg subset in the cohort of HIV-1-infected patients (HD, n = 27; All HIV-1, n = 55; Spearman correlation test). B. A negative correlation between FOXP3- naive and memory T cells and viral load that was not observed for the three populations of FOXP3+ T cells (Spearman correlation test). * p<0.05, ** p<0.01, *** p<0.0001, NS = not significant.
Figure 4
Figure 4. Susceptibility of FOXP3+ T cells to HIV-1 infection. A and B.
PBMCs were stained with anti-CD4, anti-CD45RA, anti-FOXP3, and anti-CCR5 or anti-CXCR4 antibodies, and the expression of each HIV-co-receptor was analyzed in rTregs, aTregs, FOXP3+ non-Tregs, naive, and memory T cells. Kruskall-Wallis test followed by Dunn multiple comparison post test (n = 5), * p<0.05, ** p<0.01, *** p<0.0001, NS = not significant. C and D. PBMCs were activated with PHA for 2 days and cultured in medium supplemented with IL-2. Cells were then infected with CCR5-using HIV-1 BaL (C) or CXCR4-using HIV-1 IIIB (D). The infection was quantified at day 3, 6 or 9 post-infection by measuring the expression of intracellular p24 by flow cytometry in each of the five populations of CD4+ T cells. Dot-plots (side scatter profile vs p24 antigen) from a representative experiment are shown in the left panels of (C) and (D). The percentages of positive cells for p24 expression are shown at the bottom right boxes. The mean ± SEM of 6 experiments are shown in the right panels of (C) and (D). E. The five populations of sorted CD4+ T cells were activated with PHA for 2 days and then infected with HIV-1 BaL. The levels of p24 antigen in cell supernatants were measured at 3 and 9 days post-infection by ELISA. Results are the mean ± SEM of 5 experiments.
Figure 5
Figure 5. Effect of HIV-1 infection on the production of Th1, Th17, and Th2 cytokines by FOXP3+ non-Tregs.
The cell sorting strategy to obtain FOXP3+ non-Tregs from HD was described in Figure 2. Sorted FOXP3+ non-Tregs from HD were activated with PHA for 2 days and then infected with CCR5-using HIV-1 BaL. At day 9, cells were re-stimulated with PMA/iono for 5 h, and the production of cytokines was evaluated in cell supernatants by using a Bioplex system. Results are the mean ± SEM of 5 independent experiments. * p<0.05, NS = not significant.

Similar articles

Cited by

References

    1. Fontenot JD, Gavin MA, Rudensky AY (2003) Foxp3 programs the development and function of CD4+CD25+ regulatory T cells. Nat Immunol 4: 330–336. - PubMed
    1. Roncador G, Brown PJ, Maestre L, Hue S, Martinez-Torrecuadrada JL, et al. (2005) Analysis of FOXP3 protein expression in human CD4+CD25+ regulatory T cells at the single-cell level. Eur J Immunol 35: 1681–1691. - PubMed
    1. Liu W, Putnam AL, Xu-Yu Z, Szot GL, Lee MR, et al. (2006) CD127 expression inversely correlates with FoxP3 and suppressive function of human CD4+ T reg cells. J Exp Med 203: 1701–1711. - PMC - PubMed
    1. Seddiki N, Santner-Nanan B, Martinson J, Zaunders J, Sasson S, et al. (2006) Expression of interleukin (IL)-2 and IL-7 receptors discriminates between human regulatory and activated T cells. J Exp Med 203: 1693–1700. - PMC - PubMed
    1. Miyara M, Yoshioka Y, Kitoh A, Shima T, Wing K, et al. (2009) Functional delineation and differentiation dynamics of human CD4+ T cells expressing the FoxP3 transcription factor. Immunity 30: 899–911. - PubMed

Publication types