

DNA methylation in multiple myeloma is weakly associated with gene transcription
- PMID: 23285118
- PMCID: PMC3527579
- DOI: 10.1371/journal.pone.0052626
DNA methylation in multiple myeloma is weakly associated with gene transcription
Abstract
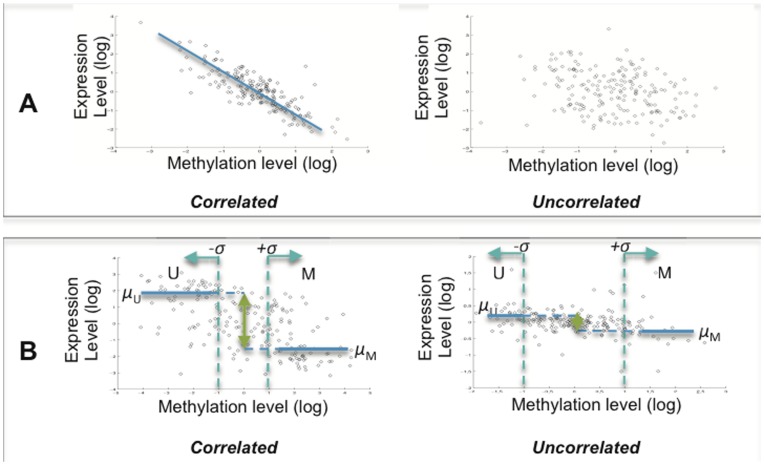
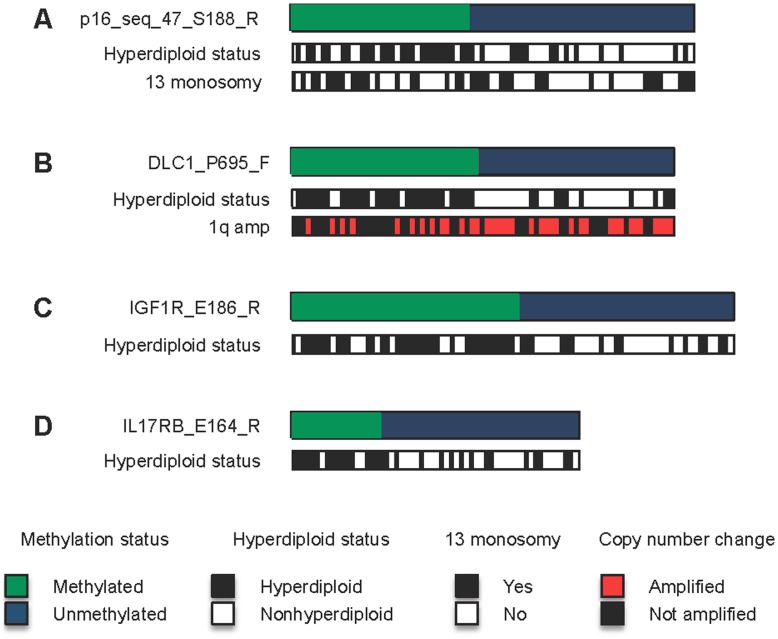
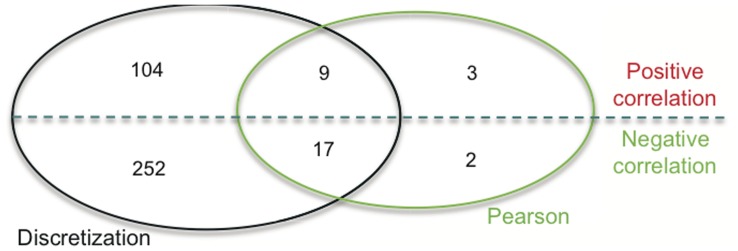
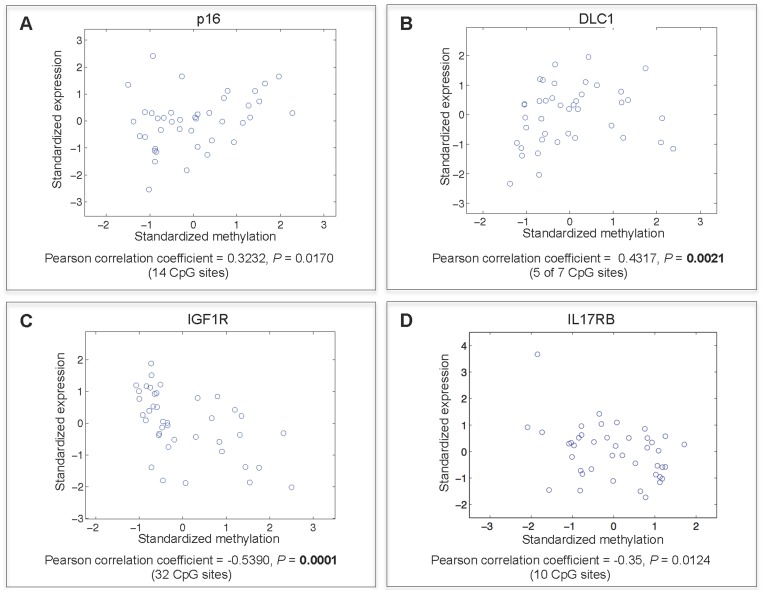
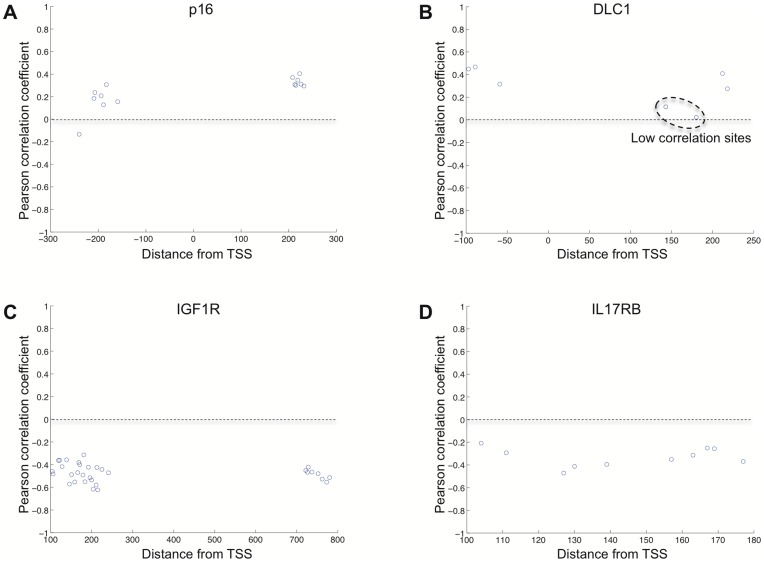
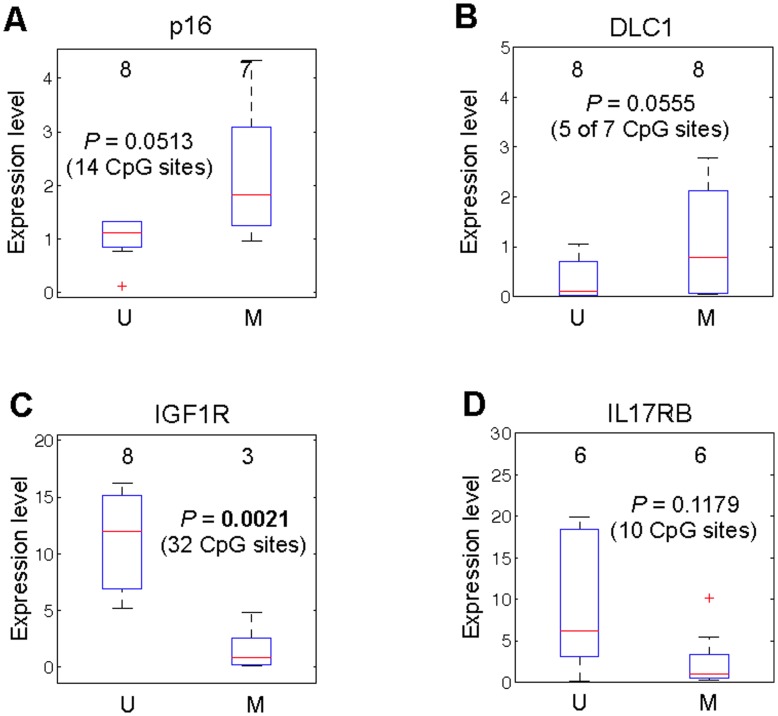
Previous studies have now demonstrated that both genic and global hypomethylation characterizes the multiple myeloma (MM) epigenome. Whether these methylation changes are associated with global and corresponding increases (or decreases) in transcriptional activity are poorly understood. The purpose of our current study was to correlate DNA methylation levels in MM to gene expression. We analyzed matching datasets generated by the GoldenGate methylation BeadArray and Affymetrix gene expression platforms in 193 MM samples. We subsequently utilized two independent statistical approaches to identify methylation-expression correlations. In the first approach, we used a linear correlation parameter by computing a Pearson correlation coefficient. In the second approach, we discretized samples into low and high methylation groups and then compared the gene expression differences between the groups. Only methylation of 2.1% and 25.3% of CpG sites on the methylation array correlated to gene expression by Pearson correlation or the discretization method, respectively. Among the genes with methylation-expression correlations were IGF1R, DLC1, p16, and IL17RB. In conclusion, DNA methylation may directly regulate relatively few genes and suggests that additional studies are needed to determine the effects of genome-wide methylation changes in MM.
Conflict of interest statement
Figures

Similar articles
-
The DNA methylation landscape of multiple myeloma shows extensive inter- and intrapatient heterogeneity that fuels transcriptomic variability.Genome Med. 2021 Aug 9;13(1):127. doi: 10.1186/s13073-021-00938-3. Genome Med. 2021. PMID: 34372935 Free PMC article.
-
Esophageal Cancer Epigenomics and Integrome Analysis of Genome-Wide Methylation and Expression in High Risk Northeast Indian Population.OMICS. 2015 Nov;19(11):688-99. doi: 10.1089/omi.2015.0121. Epub 2015 Oct 23. OMICS. 2015. PMID: 26496483
-
Exploring breast carcinogenesis through integrative genomics and epigenomics analyses.Int J Oncol. 2014 Nov;45(5):1959-68. doi: 10.3892/ijo.2014.2625. Epub 2014 Aug 27. Int J Oncol. 2014. PMID: 25175708
-
Analysis of methylation pattern in multiple myeloma.Acta Haematol. 2005;114 Suppl 1:23-6. doi: 10.1159/000087041. Acta Haematol. 2005. PMID: 16166769 Review.
-
DNA methylation of tumor suppressor protein-coding and non-coding genes in multiple myeloma.Epigenomics. 2015;7(6):985-1001. doi: 10.2217/epi.15.57. Epub 2015 Sep 29. Epigenomics. 2015. PMID: 26417914 Review.
Cited by
-
Pathway Implications of Aberrant Global Methylation in Adrenocortical Cancer.PLoS One. 2016 Mar 10;11(3):e0150629. doi: 10.1371/journal.pone.0150629. eCollection 2016. PLoS One. 2016. PMID: 26963385 Free PMC article.
-
Global methylation analysis identifies prognostically important epigenetically inactivated tumor suppressor genes in multiple myeloma.Blood. 2013 Jul 11;122(2):219-26. doi: 10.1182/blood-2013-03-487884. Epub 2013 May 22. Blood. 2013. PMID: 23699600 Free PMC article.
-
Mitochondrial Genomic Backgrounds Affect Nuclear DNA Methylation and Gene Expression.Cancer Res. 2017 Nov 15;77(22):6202-6214. doi: 10.1158/0008-5472.CAN-17-1473. Epub 2017 Jun 29. Cancer Res. 2017. PMID: 28663334 Free PMC article.
-
Association Between the Methylation Statuses at CpG Sites in the Promoter Region of the SLCO1B3, RNA Expression and Color Change in Blue Eggshells in Lushi Chickens.Front Genet. 2019 Feb 26;10:161. doi: 10.3389/fgene.2019.00161. eCollection 2019. Front Genet. 2019. PMID: 30863430 Free PMC article.
-
Deleted in liver cancer-1 (DLC1): an emerging metastasis suppressor gene.Mol Diagn Ther. 2014 Jun;18(3):293-302. doi: 10.1007/s40291-014-0086-3. Mol Diagn Ther. 2014. PMID: 24519699 Free PMC article. Review.
References
-
- Herve AL, Florence M, Philippe M, Michel A, Thierry F, et al. (2011) Molecular heterogeneity of multiple myeloma: pathogenesis, prognosis, and therapeutic implications. Journal of clinical oncology : official journal of the American Society of Clinical Oncology 29: 1893–1897. - PubMed
-
- Bergsagel PL, Kuehl WM (2005) Molecular pathogenesis and a consequent classification of multiple myeloma. J Clin Oncol 23: 6333–6338. - PubMed
Publication types
MeSH terms
LinkOut - more resources
Full Text Sources
Medical
Research Materials
