

Arrival time correction for dynamic susceptibility contrast MR permeability imaging in stroke patients
- PMID: 23285132
- PMCID: PMC3527589
- DOI: 10.1371/journal.pone.0052656
Arrival time correction for dynamic susceptibility contrast MR permeability imaging in stroke patients
Abstract
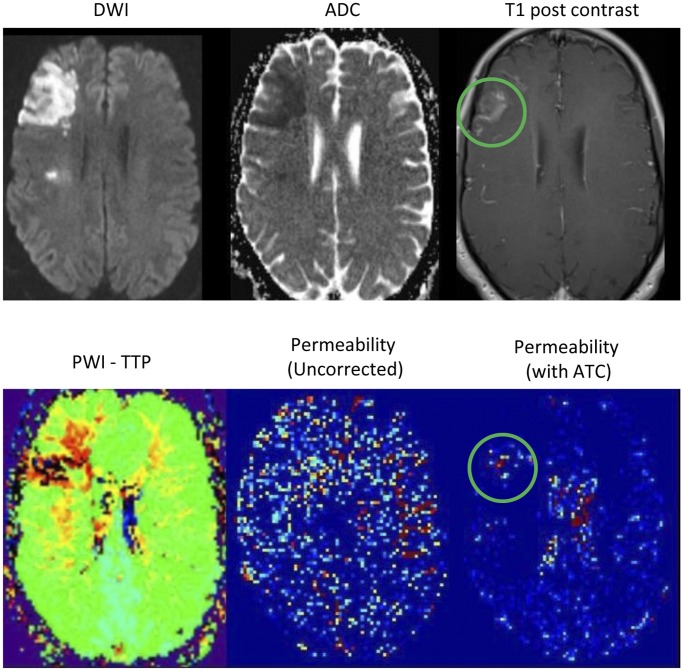
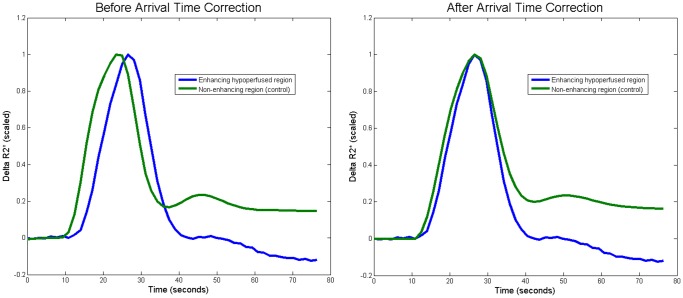
Purpose: To determine if applying an arrival time correction (ATC) to dynamic susceptibility contrast (DSC) based permeability imaging will improve its ability to identify contrast leakage in stroke patients for whom the shape of the measured curve may be very different due to hypoperfusion.
Materials and methods: A technique described in brain tumor patients was adapted to incorporate a correction for delayed contrast delivery due to perfusion deficits. This technique was applied to the MRIs of 9 stroke patients known to have blood-brain barrier (BBB) disruption on T1 post contrast imaging. Regions of BBB damage were compared with normal tissue from the contralateral hemisphere. Receiver operating characteristic (ROC) analysis was performed to compare the detection of BBB damage before and after ATC.
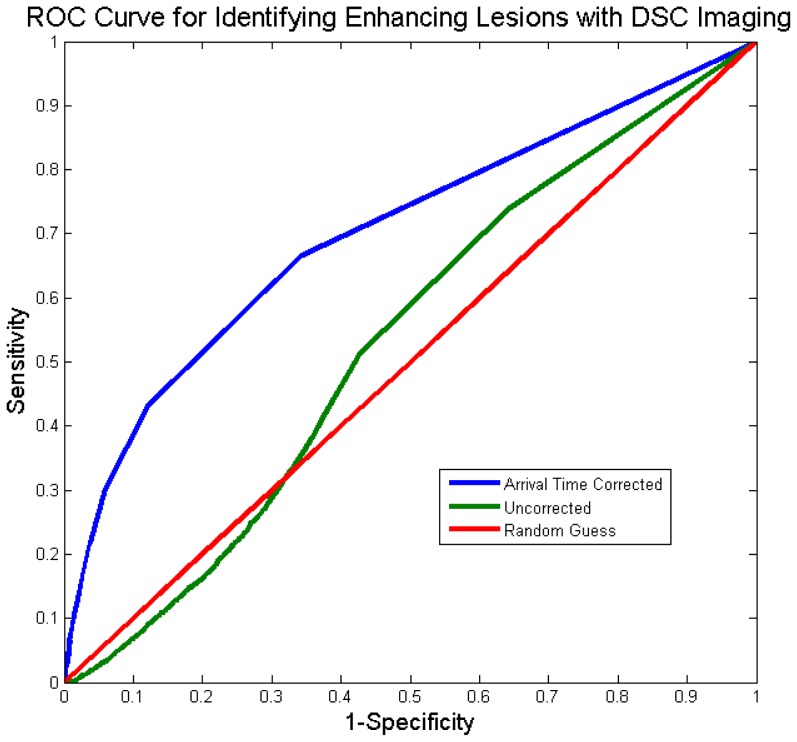
Results: ATC improved the area under the curve (AUC) of the ROC from 0.53 to 0.70. The sensitivity improved from 0.51 to 0.67 and the specificity improved from 0.57 to 0.66. Visual inspection of the ROC curve revealed that the performance of the uncorrected analysis was worse than random guess at some thresholds.
Conclusions: The ability of DSC permeability imaging to identify contrast enhancing tissue in stroke patients improved considerably when an ATC was applied. Using DSC permeability imaging in stroke patients without an ATC may lead to false identification of BBB disruption.
Conflict of interest statement
Figures
References
-
- Tofts PS, Brix G, Buckley DL, Evelhoch JL, Henderson E, et al. (1999) Estimating kinetic parameters from dynamic contrast-enhanced T(1)-weighted MRI of a diffusable tracer: standardized quantities and symbols. J Magn Reson Imaging 10: 223–232. 10.1002/(SICI)1522-2586(199909)10:3<223::AID-JMRI2>3.0.CO;2-S [pii]. - PubMed
-
- Provenzale JM, Wang GR, Brenner T, Petrella JR, Sorensen AG (2002) Comparison of permeability in high-grade and low-grade brain tumors using dynamic susceptibility contrast MR imaging. AJR Am J Roentgenol 178: 711–716. - PubMed
-
- Wintermark M, Albers GW, Alexandrov AV, Alger JR, Bammer R, et al. (2008) Acute stroke imaging research roadmap. Stroke 39: 1621–1628. STROKEAHA.107.512319 [pii];10.1161/STROKEAHA.107.512319 [doi]. - PubMed
MeSH terms
Grants and funding
LinkOut - more resources
Full Text Sources
Medical
Research Materials
