. 2012;7(12):e52712.
doi: 10.1371/journal.pone.0052712. Epub 2012 Dec 20.

Rapid and serial quantification of adhesion forces of yeast and Mammalian cells

Affiliations

Rapid and serial quantification of adhesion forces of yeast and Mammalian cells

Eva Potthoff et al. PLoS One. 2012.

Abstract

Cell adhesion to surfaces represents the basis for niche colonization and survival. Here we establish serial quantification of adhesion forces of different cell types using a single probe. The pace of single-cell force-spectroscopy was accelerated to up to 200 yeast and 20 mammalian cells per probe when replacing the conventional cell trapping cantilever chemistry of atomic force microscopy by underpressure immobilization with fluidic force microscopy (FluidFM). In consequence, statistically relevant data could be recorded in a rapid manner, the spectrum of examinable cells was enlarged, and the cell physiology preserved until approached for force spectroscopy. Adhesion forces of Candida albicans increased from below 4 up to 16 nN at 37°C on hydrophobic surfaces, whereas a Δhgc1-mutant showed forces consistently below 4 nN. Monitoring adhesion of mammalian cells revealed mean adhesion forces of 600 nN of HeLa cells on fibronectin and were one order of magnitude higher than those observed for HEK cells.


Conflict of interest statement

Competing Interests: The authors have declared that no competing interests exist.

Figures

Figure 1
Figure 1. FluidFM-based single-cell force spectroscopy.
Schematic view of the experimental principle. (A) Cell targeting and immobilization to the cantilever through the application of under pressure. (B) Single-cell force spectroscopy and subsequent release of the measured cell.
Figure 2
Figure 2. Representative example of the force-distance (F–D) curves that were obtained with a C. albicans cell on DDP (A) and a HeLa cell on fibronectin (B).
The data show a force range between 20 and 800 nN (red: approach, blue: retraction curve). The maximal adhesion force was computed as the minimum force value (FAdh). The work performed by the Z-piezo during the detachment process (WAdh) was calculated as the area below the baseline (shaded area). The distance (d) is the distance required for the complete separation of the yeast cell from the substrate.
Figure 3
Figure 3. The adhesion forces depend on the retraction speed and the contact time.
(A) Dependence of the adhesion force on the retraction speed with a constant contact time of 30 s. The data were obtained with a C. albicans cell on DDP (red) and glass (blue). (B) Dependence of the adhesion force on the contact time. The data were obtained using a C. albicans cell on DDP at three different retraction speeds: 300 nm/s (black), 500 nm/s (red) and 2000 nm/s (blue). Between 5 and 10 F–D curves were randomly recorded per condition. The data shown represent the mean ± standard error. The results in A and B demonstrate that repeated measurements with the same cell do not exhibit a high variance in the adhesion forces.
Figure 4
Figure 4. Adhesion of C. albicans to moderately hydrophobic substrates.
(A) Time-dependent comparison of the maximal adhesion forces at 23 and 37°C. (B) Correlation of FAdh and WAdh at 23°C throughout the 9 hours of adhesion; R2  = 0.96. The analysis in (A) involved the recording of at least 7 F–D curves per condition and time frame. The data represent the mean ± standard error.
Figure 5
Figure 5. Maximal adhesion forces of yeast and mammalian cells to abiotic substrates.
(A) Comparison of the maximal adhesion forces of C. albicans and S. cerevisiae to hydrophobic DDP and hydrophilic DDP-OH surfaces at 30°C after an adhesion time of 15 min. The data represent the mean ± standard error of 5–14 measurements per yeast and substrate. (B) Comparison of the maximal adhesion forces of HeLa and HEK cells to glass and fibronectin-coated substrates at 37°C after overnight contact with the cell substrate. A total of 12 and 11 HeLa cells were measured on the glass and fibronectin substrates, respectively, whereas 8 and 9 HEK cells were measured on the glass and on fibronectin substrates, respectively. The data represent the mean ± standard error. The force spectroscopy data, which were obtained when the cell was detached from the cantilever, were not included in the mean and error calculations.
Figure 6
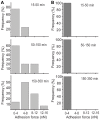
Figure 6. Comparison of adhesion forces of C. albicans wild type and Δhgc1 cells at 37°C.
(A) Distribution of adhesion forces of C. albicans wild type and (B) Δhgc1 cells on moderate hydrophobic substrate. Yeasts were grown at the same temperature the experiment was performed.

Similar articles

Cited by

References

    1. Baror Y (1990) The effect of adhesion on survival and growth of microorganisms. Experientia 46: 823–826.
    1. An YH, Friedman RJ (1997) Laboratory methods for studies of bacterial adhesion. Journal of Microbiological Methods 30: 141–152.
    1. Ashkin A, Dziedzic JM (1987) Optical trapping and manipulation of viruses and bacteria. Science 235: 1517–1520. - PubMed
    1. Walter N, Selhuber C, Kessler H, Spatz JP (2006) Cellular unbinding forces of initial adhesion processes on nanopatterned surfaces probed with magnetic tweezers. Nano Letters 6: 398–402. - PubMed
    1. Tsang PH, Li GL, Brun YV, Ben Freund L, Tang JX (2006) Adhesion of single bacterial cells in the micronewton range. Proceedings of the National Academy of Sciences of the United States of America 103: 5764–5768. - PMC - PubMed

Publication types