

Detection and plant monitoring programs: lessons from an intensive survey of Asclepias meadii with five observers
- PMID: 23285179
- PMCID: PMC3527611
- DOI: 10.1371/journal.pone.0052762
Detection and plant monitoring programs: lessons from an intensive survey of Asclepias meadii with five observers
Abstract
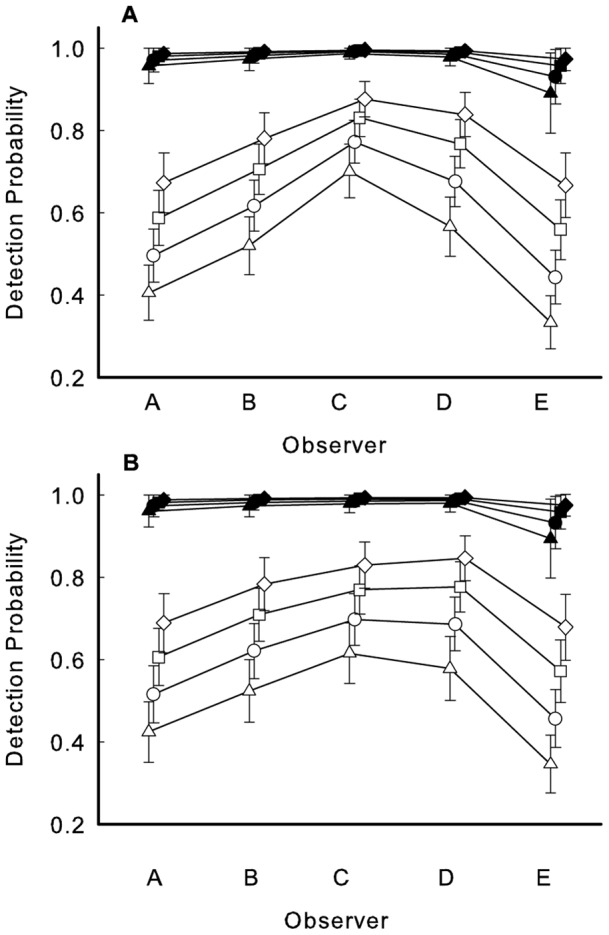
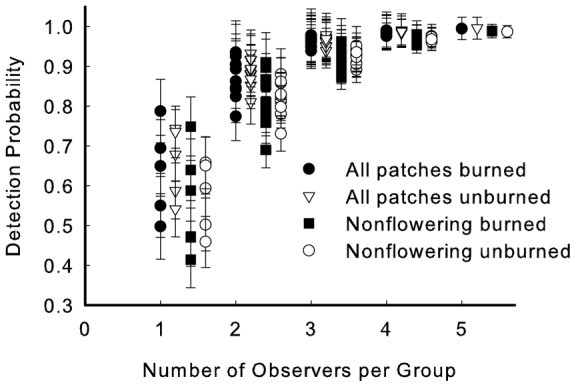
Monitoring programs, where numbers of individuals are followed through time, are central to conservation. Although incomplete detection is expected with wildlife surveys, this topic is rarely considered with plants. However, if plants are missed in surveys, raw count data can lead to biased estimates of population abundance and vital rates. To illustrate, we had five independent observers survey patches of the rare plant Asclepias meadii at two prairie sites. We analyzed data with two mark-recapture approaches. Using the program CAPTURE, the estimated number of patches equaled the detected number for a burned site, but exceeded detected numbers by 28% for an unburned site. Analyses of detected patches using Huggins models revealed important effects of observer, patch state (flowering/nonflowering), and patch size (number of stems) on probabilities of detection. Although some results were expected (i.e. greater detection of flowering than nonflowering patches), the importance of our approach is the ability to quantify the magnitude of detection problems. We also evaluated the degree to which increased observer numbers improved detection: smaller groups (3-4 observers) generally found 90 - 99% of the patches found by all five people, but pairs of observers or single observers had high error and detection depended on which individuals were involved. We conclude that an intensive study at the start of a long-term monitoring study provides essential information about probabilities of detection and what factors cause plants to be missed. This information can guide development of monitoring programs.
Conflict of interest statement
Figures
References
-
- Kéry M, Schmidt BR (2008) Imperfect detection and its consequences for monitoring for conservation. Community Ecology 9: 207–216.
-
- Regan TJ, Chades I, Possingham HP (2011) Optimally managing under imperfect detection: a method for plant invasions. Journal of Applied Ecology 48: 76–85.
-
- Samson F, Knopf F (1994) Prairie conservation in North America. Bioscience 44: 418–421.
-
- Williams BK, Nichols JD, Conroy MJ (2002) Analysis and Management of Animal Populations. San Diego: Academic Press.
-
- Amstrup SC, McDonald TI, Manly BFJ (2003) Handbook of Capture-Recapture Analysis. Princeton, N.J.: Princeton University Press.
Publication types
MeSH terms
LinkOut - more resources
Full Text Sources
