. 2012;7(12):e52788.
doi: 10.1371/journal.pone.0052788. Epub 2012 Dec 28.

N-methyl-D-aspartate receptor-dependent denitrosylation of neuronal nitric oxide synthase increase the enzyme activity

Affiliations

N-methyl-D-aspartate receptor-dependent denitrosylation of neuronal nitric oxide synthase increase the enzyme activity

Zhong-Wei Qu et al. PLoS One. 2012.

Abstract

Our laboratory once reported that neuronal nitric oxide synthase (nNOS) S-nitrosylation was decreased in rat hippocampus during cerebral ischemia-reperfusion, but the underlying mechanism was unclear. In this study, we show that nNOS activity is dynamically regulated by S-nitrosylation. We found that overexpressed nNOS in HEK293 (human embryonic kidney) cells could be S-nitrosylated by exogenous NO donor GSNO and which is associated with the enzyme activity decrease. Cys(331), one of the zinc-tetrathiolate cysteines, was identified as the key site of nNOS S-nitrosylation. In addition, we also found that nNOS is highly S-nitrosylated in resting rat hippocampal neurons and the enzyme undergos denitrosylation during the process of rat brain ischemia/reperfusion. Intrestingly, the process of nNOS denitrosylation is coupling with the decrease of nNOS phosphorylation at Ser(847), a site associated with nNOS activation. Further more, we document that nNOS denitrosylation could be suppressed by pretreatment of neurons with MK801, an antagonist of NMDAR, GSNO, EGTA, BAPTA, W-7, an inhibitor of calmodulin as well as TrxR1 antisense oligonucleotide (AS-ODN) respectively. Taken together, our data demonstrate that the denitrosylation of nNOS induced by calcium ion influx is a NMDAR-dependent process during the early stage of ischemia/reperfusion, which is majorly mediated by thioredoxin-1 (Trx1) system. nNOS dephosphorylation may be induced by the enzyme denitrosylation, which suggest that S-nitrosylation/denitrosylation of nNOS may be an important mechanism in regulating the enzyme activity.


Conflict of interest statement

Competing Interests: The authors have declared that no competing interests exist.

Figures

Figure 1
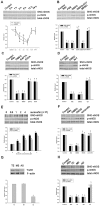
Figure 1. Effects of the exogenous NO donor GSNO on the S-nitrosylation of nNOS overexpressed in HEK293 cells.
A, Optimization of the GSNO concentration required for nNOS S-nitrosylation. HEK293 cells were transfected with pME18S-nNOS for 48 h before treatment with different concentrations of GSNO for 1 h. B, Time course analysis of the SNO-nNOS levels in transfected HEK293 cells treated with GSNO (100 μΜ). C, Transfected HEK293 cells administrated with or without GSNO (100 μΜ), NEM (1 mM, a sulfydryl alkylating agent) or DTT (10 mM, a reducing agent). SNO-nNOS was then examined using a biotin-switch assay. D, Transfected HEK293 cells were administrated with GSNO or old GSNO, with or without Vc, during the biotin switch assay. E, transfected HEK293 cells were incubated for 30 minutes in the presence or absence of GSNO (100 μΜ) before treatment with or without A23187 (10 μΜ) for another 30 minutes. The bands were scanned and the intensities are expressed as the fold-changes with respect to the 0 group. The values shown are the mean ± SD (n = 4). a P<0.02 versus the 0 group.
Figure 2
Figure 2. Identification of the nNOS S-nitrosylated site and examination of the regulation of nNOS S-nitrosylation.
A, Wild type and mutant pME18S-nNOS plasmids were transfected into HEK293 cells for 48 hours, then the cells were then treated with GSNO (100 μΜ) or not for 1 hour. The blot shown is representative of three independent experiments that yielded equivalent results. B, Transfected HEK293 cells were incubated with or without GSNO and protein extracts were used to determine the nNOS activity levels. The enzyme activity levels were determined using the Nitric Oxide Synthase Kit (Nanjing Jiancheng Bioengineering Institute) in accordance with the manufacturer’s protocol. The data shown are the mean ± SD of five independent experiments (n = 5). * P<0.02 versus WT/C326G nNOS GSNO+ groups or WT nNOS GSNO- groups. C, D and E, Characterization of the S-nitrosylation and phosphorylation status of wild type nNOS (WT-nNOS), C331G nNOS and S847A nNOS exogenously expressed in HEK293 cells. The cells were incubated for 30 minutes in the presence or absence of GSNO (100μΜ) before treatment with or without A23187 (10μΜ) for an additional 30 minutes. The phosphorylation of nNOS was tested by immunoblotting with an anti-NP847 antibody. The blots shown are representative of three independent experiments.
Figure 3
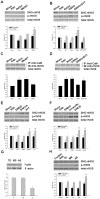
Figure 3. Effects of different drugs on the S-nitrosylation of nNOS in primary cortical neurons induced by oxygen-glucose deprivation/reperfusion (OGD/reoxygenation).
A, Time course analysis of the S-nitrosylation and phosphorylation levels of nNOS in primary cortical neurons at various reperfusion time points after OGD. The data shown are the means ± S.D. from three independent experiments. a P<0.05 versus the control group; b P<0.05 versus the R6h group. B, The effects of GSNO (100 μΜ), or co-treatment with DTT (10 mM), and MK801 (20 μΜ) on the Ser847 phosphorylation and S-nitrosylation levels for nNOS induced by OGD followed by 6 hours of reoxygenation in primary cortical neurons. The blots shown are representative of three independent experiments (n = 3); a P<0.05 versus the control group; b P<0.05 versus the PBS group. C, Optimization of the auranofin concentration in the nNOS S-nitrosylation experiment in primary cortical neurons induced by OGD followed by 6 hours of reoxygenation. The bands shown are representative of three independent experiments. a P<0.05 versus the 0 μΜ group. D-F, The effects of auranofin (4 μΜ), DNCB (2 μΜ), BAPTA (4 μΜ), EGTA (25 mΜ) and W-7 (40 μΜ) on the Ser847 phosphorylation and S-nitrosylation of nNOS induced by OGD followed by 6 hours of reoxygenation in primary cortical neurons. The bands shown are representative of three independent experiments; a P<0.05 versus the control group; b P<0.05 versus the DMSO group. G, TrxR1 AS, TrxR1 MS oligonucleotide, or vehicle (TE) was administrated at a concentration of 1 µM to rat primary cortical neurons every 24 hours for five days prior to OGD. After 6 hours of reoxygenation, the cells were harvested and TrxR1 was analyzed by western blotting (n = 3); a P<0.05 versus the vehicle group. H, The effects of TrxR1 AS on the phosphorylation and S-nitrosylation of nNOS induced by OGD followed by 6 hours of reoxygenation in primary cortical neurons. The blots shown are representative of three independent experiments; a P<0.05 versus the control group; b P<0.05 versus the vehicle group.
Figure 4
Figure 4. Effects of various drugs on the S-nitrosylation of nNOS in hippocampal CA1 neurons induced by cerebral ischemia/reperfusion.
A, Western blotting analysis of the effects of MK801 on the Ser847 phosphorylation and the S-nitrosylation of nNOS induced by transient brain ischemia followed by 6 hours of reperfusion in rat hippocampal CA1 neurons. B, Western blotting analysis of the effects of GSNO, or its co-application with DTT, on the Ser847 phosphorylation and S-nitrosylation of nNOS induced by transient brain ischemia followed by 6 hours of reperfusion in rat hippocampal CA1 cells. C-D, Analysis of the effects of MK801, GSNO alone or with DTT, on the assembly of nNOS and CaM induced by transient brain ischemia followed by 6 hours of reperfusion in hippocampal CA1 cells. E-F, The effects of BAPTA, W-7, auranofin and DNCB, on the Ser847 phosphorylation and the S-nitrosylation of nNOS induced by transient brain ischemia followed by 6 hours of reperfusion in rat hippocampal CA1 neurons. G, 10 mmol of TrxR1 AS of TrxR1 MS oligonucleotides, or vehicle (TE) was administered to the rats every 24 hours for three days though a cerebral ventricular injection prior to cerebral ischemia. After 6 hours of reperfusion, protein extracts were made and TrxR1 was analyzed by western blotting. H, The effects of TrxR1 AS on the phosphorylation and S-nitrosylation of nNOS induced by cerebral ischemia followed by 6 hours of reperfusion in rat hippocampal CA1 cells. Sample proteins were examined by immunoprecipitation (IP) with anti-CaM antibody followed by immunoblotting with anti-nNOS antibody. The bands were scanned to calculate the intensities, which are represented as the fold-changes versus the sham treatment. The data values shown are the means±S.D. from four independent experiments; a P<0.05 versus the sham group; b P<0.05 versus the vehicle group.
Figure 5
Figure 5. Effects of TrxR1 knockdown by siRNA in SH-SY5Y cells.
A, Successful transfection of SH-SY5Y cells with a fluorescein-labeled scrambled-control siRNA. Photomicrographs were captured under a fluorescence microscope at a 400× original magnification at the end of the transfection period. BF, bright field; FAM, fluorescence from fluorescein-labeled scramble-siRNA. B, C, Relative protein expression and mRNA levels of TrxR1 are decreased in the siRNA-1 and siRNA-4 groups at 24 hours post-transfection as compared with the non-transfected control group. The results are the means±S.D. of three separate experiments; a P<0.05 versus the control group. D, The effects of an siRNA mixture (siRNA-1 and siRNA-4) on the S-nitrosylation and phosphorylation of nNOS in SH-SY5Y cells induced by OGD for 5 hours followed by 6 hours of reoxygenation. The bands shown are representative of three independent experiments; a P<0.05 versus the control group; b P<0.05 versus the negative control (NC) group. E, DAPI staining of SH-SY5Y cells induced by OGD for 5 h followed by 24 h of reoxygenation. Typical apoptotic cells with a condensed nucleus are indicated by arrowheads. Quantitative representations are expressed as a percentage of the total cells in 10 microscopic fields (×400) for DAPI staining. a P<0.05 versus the control group; b P<0.05 versus the NC group.
Figure 6
Figure 6. Inhibition of primary cortical neuronal apoptosis induced by OGD/reoxygenation.
DAPI staining of primary cortical neurons was carried out at 24 hours after OGD. Typical apoptotic cells with condensed nuclei are marked by arrowheads. Primary cortical neurons of the R24h group were subjected to oxygen-glucose deprivation for two hours. Neurons in the drug treatment groups were exposed to GSNO, GSNO+DTT, MK801, BAPTA, EGTA, auranofin, DNCB and W-7 for 15 min before OGD. TrxR1 AS-ODNs or MS-ODNs were then administered every 24 hours for five days from day 14 of start of the cultures. PBS, DMSO and TE groups were used as vehicle controls. The number of apoptotic-like cells was expressed as a percentage of the total cell population counted in 10 microscopic fields (×400) via DAPI staining. The data shown are the means ± S.D. of four independent experiments; a P<0.05 versus the control group; b P<0.05 versus the PBS group; c P<0.05 versus the DMSO group; d P<0.05 versus the TE group.
Figure 7
Figure 7. Neuroprotective properties of nNOS denitrosylation inhibition against neuronal injury in rat hippocampal CA1 cells induced by transient brain ischemia followed by five days of reperfusion.
Coronal sections are shown from rats subjected to sham (panels a and b), R5d (panels c and d), pretreatment with saline (panels e and f), GSNO (panels g and h), GSNO+DTT (panels i and j), MK801 (panels k and l), DMSO (panels m and n), BAPTA (panels o and p), auranofin (panels q and r), TE (panels s and t), MS (panels u and v) and AS (panels w and x) treatments. Results were obtained from six independent animals from each experimental group, and the results of a typical experiment are presented. The boxed area in the left column is shown at a higher magnification in the right column. The original magnification is ×40 in all panels. Scale bars, 200 µm (panel f) and 10 µm (panel l). The numbers of viable cells were counted over a 1 mm region; a P<0.05 versus the sham group; b P<0.05 versus the saline group; c P<0.05 versus the DMSO group; d p<0.05 versus the TE group.
Figure 8
Figure 8. Representative photomicrographs of hippocampal cells subjected to TUNEL staining and counterstained with methyl green.
Coronal sections are shown from rats subjected to sham (panels a and b), R3d (panels c and d), pretreatment with saline (panels e and f), GSNO (panels g and h), GSNO+DTT (panels i and j), MK801 (panels k and l), DMSO (panels m and n), BAPTA (panels o and p), auranofin (panels q and r), TE (panels s and t), MS (panels u and v) and AS (panels w and x) treatments. Results were obtained from six independent animals from each experimental group, and the results of a typical experiment are presented. The boxed area in the left column is shown at a higher magnification in the right column. The original magnification is ×40 in all panels. Scale bars, 200 µm (panel f) and 10 µm (panel l). The numbers of viable cells were counted over a 1 mm region; a P<0.05 versus the sham group; b P<0.05 versus the saline group; c P<0.05 versus the DMSO group; d P<0.05 versus the TE group.

Similar articles

Cited by

References

    1. Stuart-Smith K (2002) Demystified. Nitric oxide. Mol Pathol 55: 360–366. - PMC - PubMed
    1. Andrew PJ, Mayer B (1999) Enzymatic function of nitric oxide synthases. Cardiovasc Res 43: 521–531. - PubMed
    1. Stamler JS, Simon DI, Osborne JA, Mullins ME, Jaraki O, et al. (1992) S-nitrosylation of proteins with nitric oxide: synthesis and characterization of biologically active compounds. Proc Natl Acad Sci U S A 89: 444–448. - PMC - PubMed
    1. Jaffrey SR (2005) Detection and characterization of protein nitrosothiols. Methods in Enzymology 396: 105–118. - PubMed
    1. López-Sánchez LM, Corrales FJ, De La Mata M, Muntané J, Rodríguez-Ariza A (2008) Detection and proteomic identification of S-nitrosated proteins in human hepatocytes. Methods Enzymol 440: 273–281. - PubMed

Publication types

MeSH terms