

PKC activation by resveratrol derivatives with unsaturated aliphatic chain
- PMID: 23285216
- PMCID: PMC3528653
- DOI: 10.1371/journal.pone.0052888
PKC activation by resveratrol derivatives with unsaturated aliphatic chain
Abstract
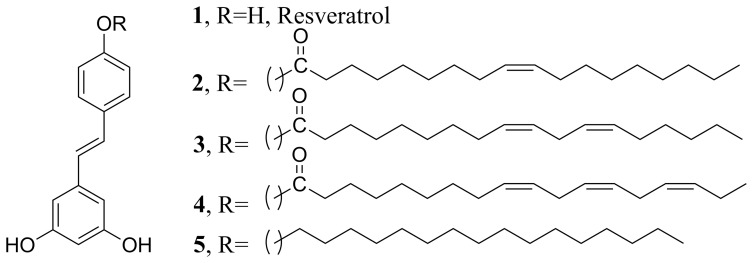
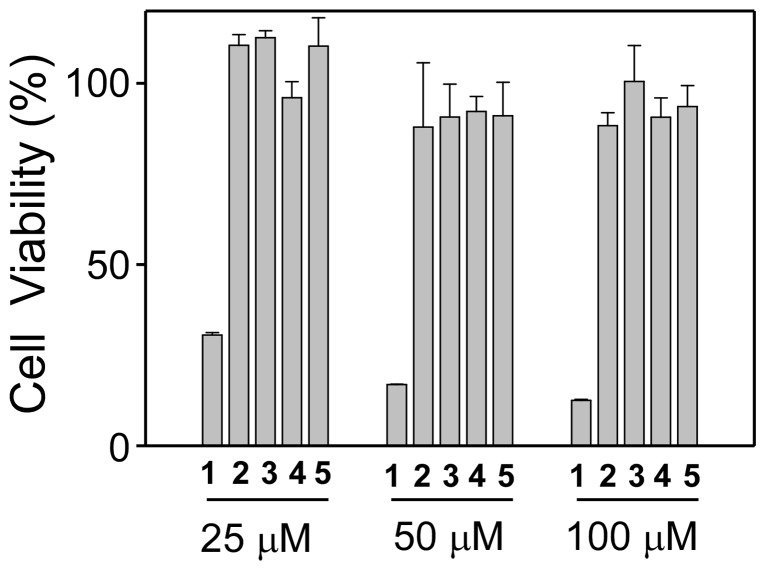
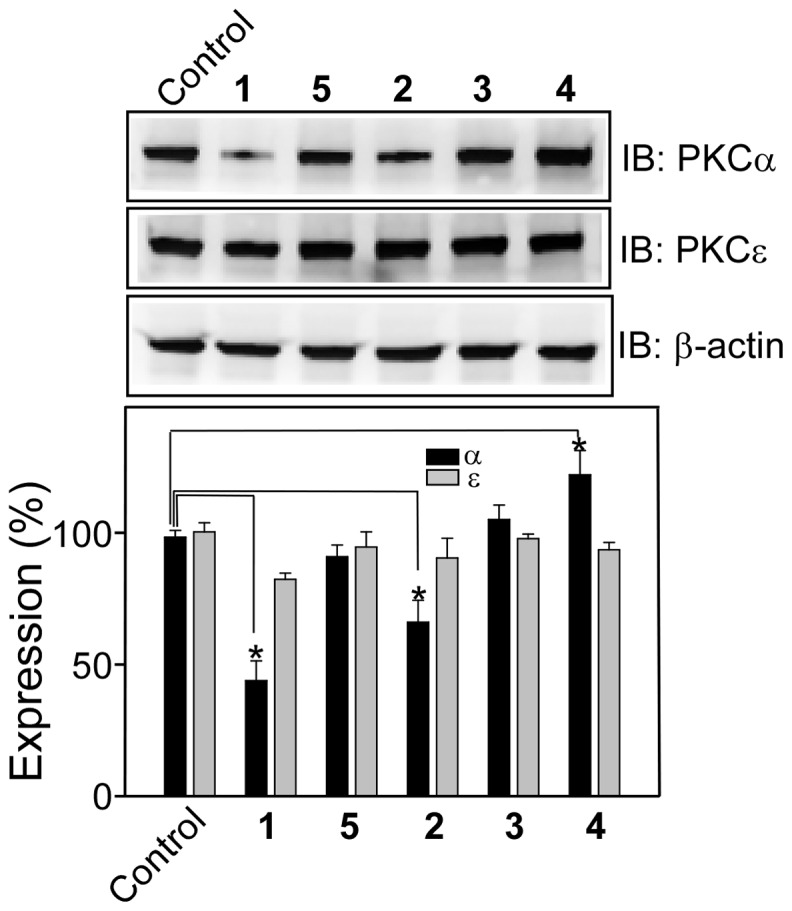
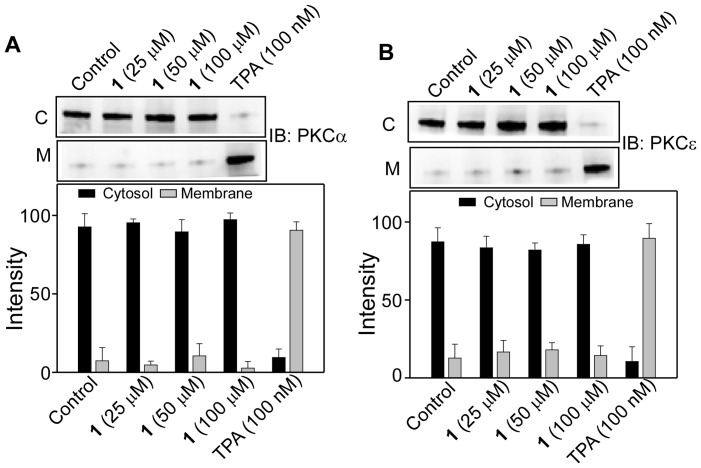
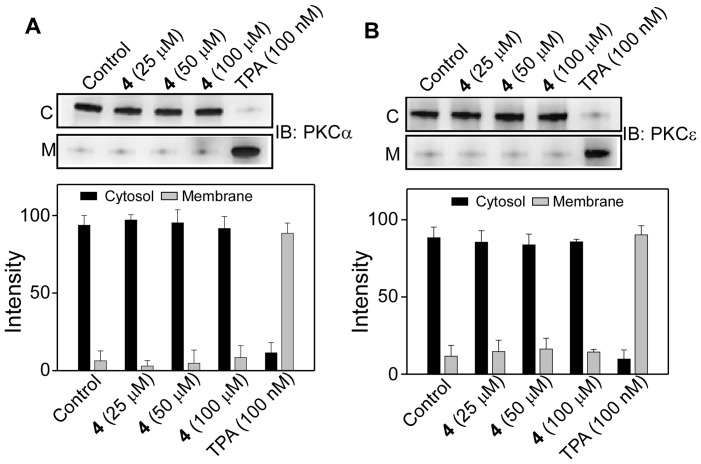
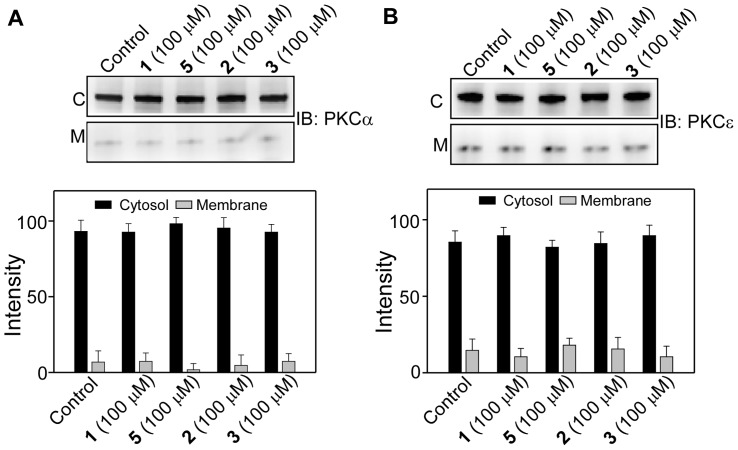
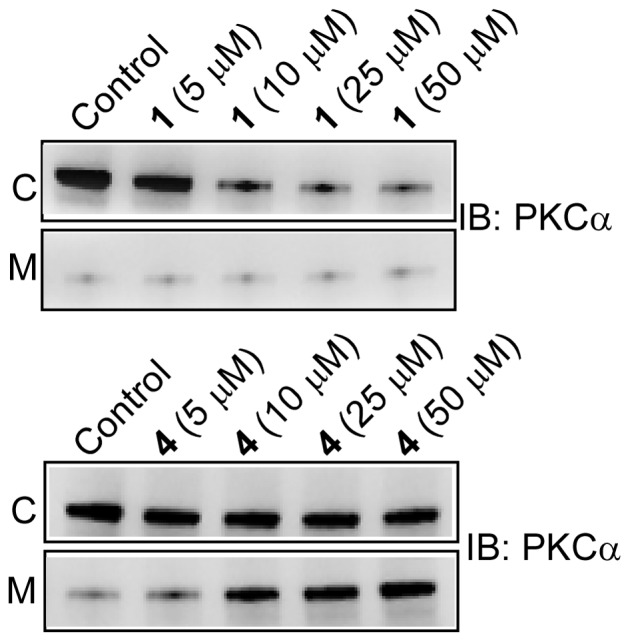
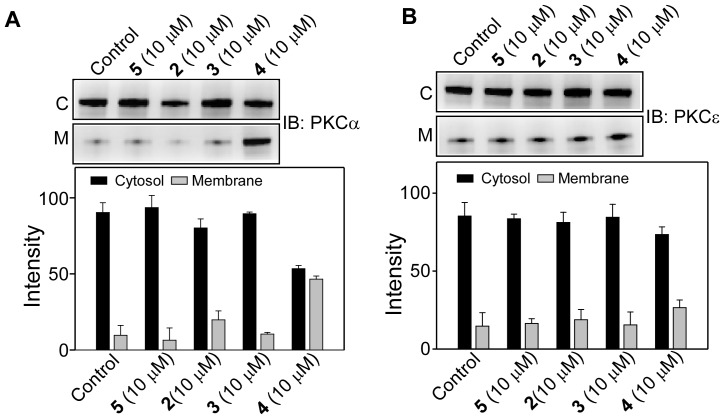
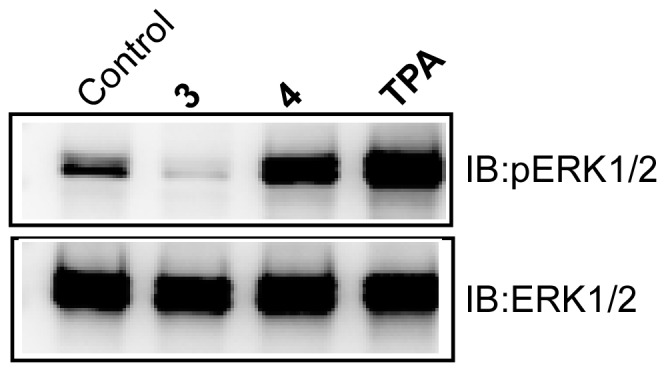
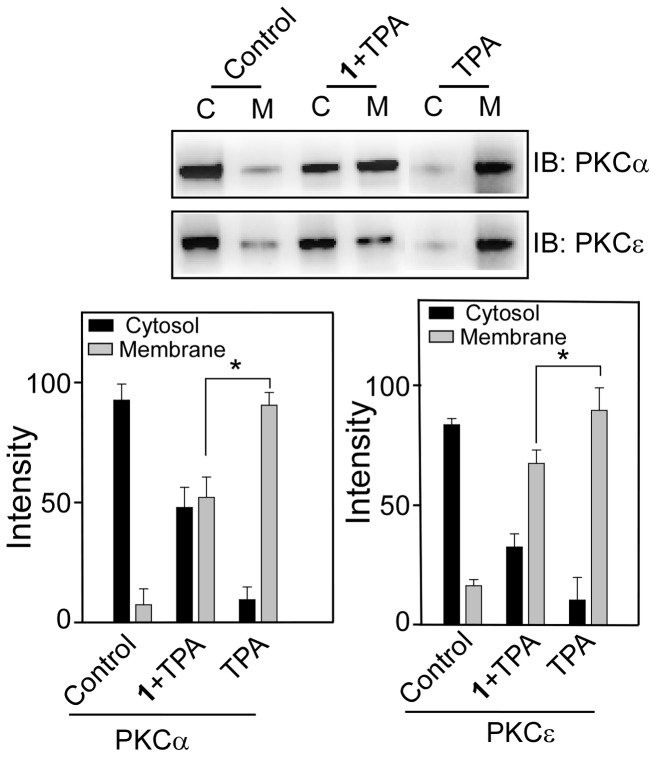
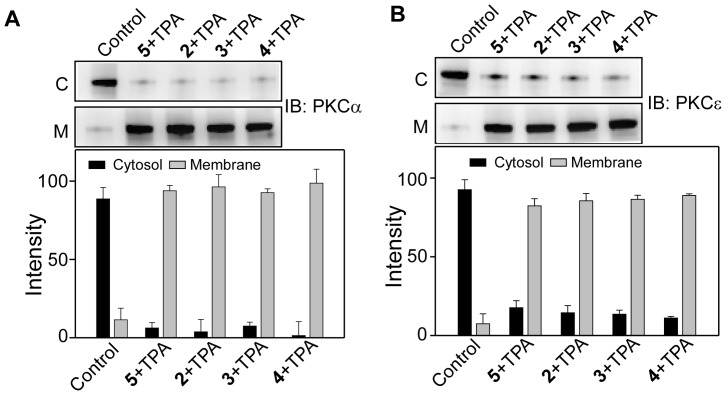
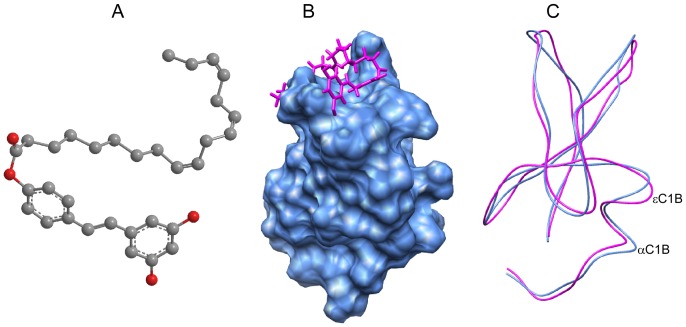
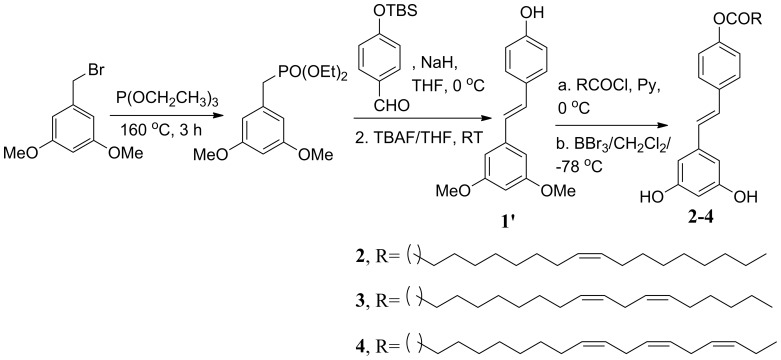
Resveratrol (1) is a naturally occurring phytoalexin that affects a variety of human disease models, including cardio- and neuroprotection, immune regulation, and cancer chemoprevention. One of the possible mechanisms by which resveratrol affects these disease states is by affecting the cellular signaling network involving protein kinase C (PKC). PKC is the family of serine/threonine kinases, whose activity is inhibited by resveratrol. To develop PKC isotype selective molecules on the resveratrol scaffold, several analogs (2-5) of resveratrol with a long aliphatic chain varying with number of unsaturated doubled bonds have been synthesized, their cytotoxic effects on CHO-K1 cells are measured and their effects on the membrane translocation properties of PKCα and PKCε have been determined. The analogs showed less cytotoxic effects on CHO-K1 cells. Analog 4 with three unsaturated double bonds in its aliphatic chain activated PKCα, but not PKCε. Analog 4 also activated ERK1/2, the downstream proteins in the PKC signaling pathway. Resveratrol analogs 2-5, however, did not show any inhibition of the phorbol ester-induced membrane translocation for either PKCα or PKCε. Molecular docking of 4 into the activator binding site of PKCα revealed that the resveratrol moiety formed hydrogen bonds with the activator binding residues and the aliphatic chain capped the activator binding loops making its surface hydrophobic to facilitate its interaction with the plasma membrane. The present study shows that subtle changes in the resveratrol structure can have profound impact on the translocation properties of PKCs. Therefore, resveratrol scaffold can be used to develop PKC selective modulators for regulating associated disease states.
Conflict of interest statement
Figures
Similar articles
-
Selective Modulation of Protein Kinase C α over Protein Kinase C ε by Curcumin and Its Derivatives in CHO-K1 Cells.Biochemistry. 2016 Apr 12;55(14):2135-43. doi: 10.1021/acs.biochem.6b00057. Epub 2016 Mar 25. Biochemistry. 2016. PMID: 26983836
-
Chemical modifications of resveratrol for improved protein kinase C alpha activity.Bioorg Med Chem. 2011 Sep 15;19(18):5321-33. doi: 10.1016/j.bmc.2011.08.008. Epub 2011 Aug 11. Bioorg Med Chem. 2011. PMID: 21880495
-
Resveratrol antagonizes EGFR-dependent Erk1/2 activation in human androgen-independent prostate cancer cells with associated isozyme-selective PKC alpha inhibition.Invest New Drugs. 2004 Apr;22(2):107-17. doi: 10.1023/B:DRUG.0000011787.75522.ec. Invest New Drugs. 2004. PMID: 14739659
-
Molecular mechanisms of protein kinase C-induced apoptosis in prostate cancer cells.J Biochem Mol Biol. 2005 Nov 30;38(6):639-45. doi: 10.5483/bmbrep.2005.38.6.639. J Biochem Mol Biol. 2005. PMID: 16336777 Review.
-
PKC-delta and PKC-epsilon: foes of the same family or strangers?J Mol Cell Cardiol. 2011 Nov;51(5):665-73. doi: 10.1016/j.yjmcc.2011.07.013. Epub 2011 Jul 23. J Mol Cell Cardiol. 2011. PMID: 21810427 Review.
Cited by
-
Polyphenol compounds and PKC signaling.Biochim Biophys Acta. 2016 Oct;1860(10):2107-21. doi: 10.1016/j.bbagen.2016.06.022. Epub 2016 Jun 29. Biochim Biophys Acta. 2016. PMID: 27369735 Free PMC article. Review.
-
Resveratrol inhibits phorbol ester-induced membrane translocation of presynaptic Munc13-1.Biochim Biophys Acta Gen Subj. 2017 Nov;1861(11 Pt A):2640-2651. doi: 10.1016/j.bbagen.2017.07.006. Epub 2017 Jul 13. Biochim Biophys Acta Gen Subj. 2017. PMID: 28713022 Free PMC article.
-
Resveratrol alleviates oxygen/glucose deprivation/reoxygenation‑induced neuronal damage through induction of mitophagy.Mol Med Rep. 2021 Jan;23(1):73. doi: 10.3892/mmr.2020.11711. Epub 2020 Nov 25. Mol Med Rep. 2021. PMID: 33236158 Free PMC article.
-
Signal transduction in inherited metabolic disorders: a model for a possible pathogenetic mechanism.J Inherit Metab Dis. 2015 Jul;38(4):729-40. doi: 10.1007/s10545-015-9820-1. Epub 2015 Mar 4. J Inherit Metab Dis. 2015. PMID: 25735935 Review.
-
Polyphenols: Natural food grade biomolecules for treating neurodegenerative diseases from a multi-target perspective.Front Nutr. 2023 Feb 28;10:1139558. doi: 10.3389/fnut.2023.1139558. eCollection 2023. Front Nutr. 2023. PMID: 36925964 Free PMC article. Review.
References
-
- Pervaiz S (2003) Resveratrol: from grapevines to mammalian biology. FASEB J 17: 1975–1985. - PubMed
-
- Wang Y, Catana F, Yang Y, Roderick R, van Breemen RB (2002) An LC-MS method for analyzing total resveratrol in grape juice, cranberry juice, and in wine. J Agric Food Chem 50: 431–435. - PubMed
-
- Wu JM, Hsieh TC (2011) Resveratrol: a cardioprotective substance. Ann N Y Acad Sci 1215: 16–21. - PubMed
-
- Petrovski G, Gurusamy N, Das DK (2011) Resveratrol in cardiovascular health and disease. Ann N Y Acad Sci 1215: 22–33. - PubMed
-
- Szekeres T, Saiko P, Fritzer-Szekeres M, Djavan B, Jager W (2011) Chemopreventive effects of resveratrol and resveratrol derivatives. Ann N Y Acad Sci 1215: 89–95. - PubMed
MeSH terms
Substances
LinkOut - more resources
Full Text Sources
Other Literature Sources
Miscellaneous
