. 2012;7(12):e53136.
doi: 10.1371/journal.pone.0053136. Epub 2012 Dec 28.

Extracellular ATP signaling is mediated by H₂O₂ and cytosolic Ca²⁺ in the salt response of Populus euphratica cells

Affiliations

Extracellular ATP signaling is mediated by H₂O₂ and cytosolic Ca²⁺ in the salt response of Populus euphratica cells

Jian Sun et al. PLoS One. 2012.

Abstract

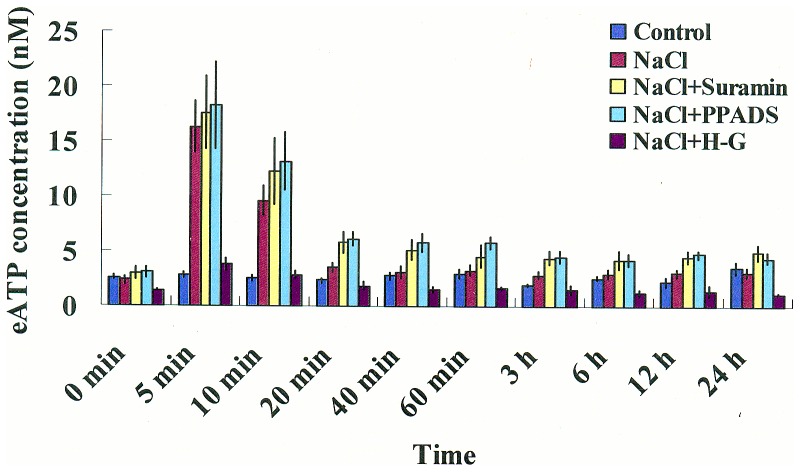
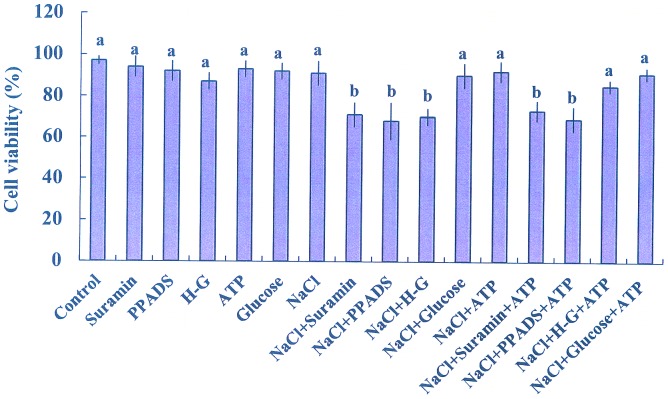
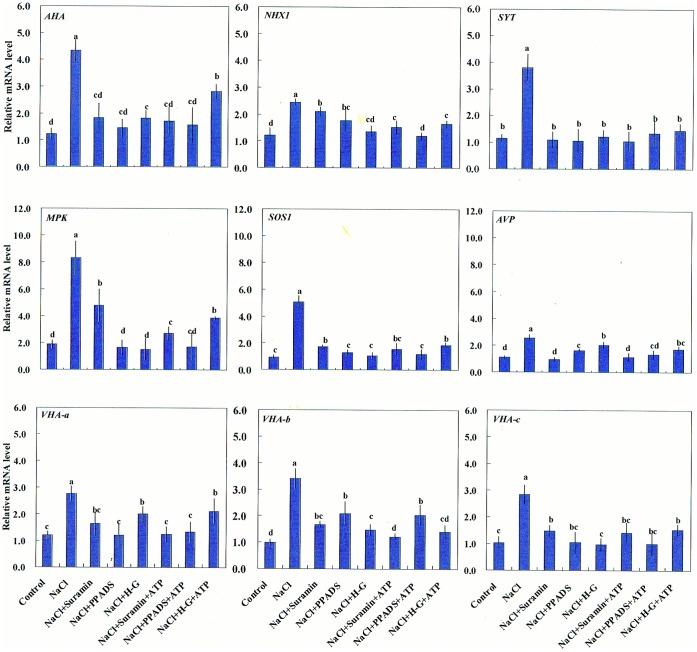
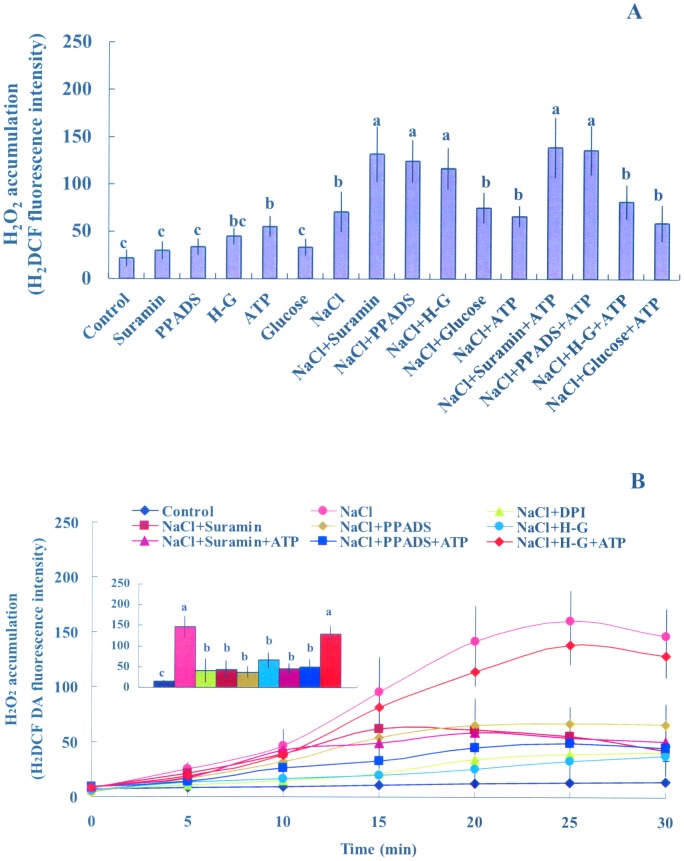
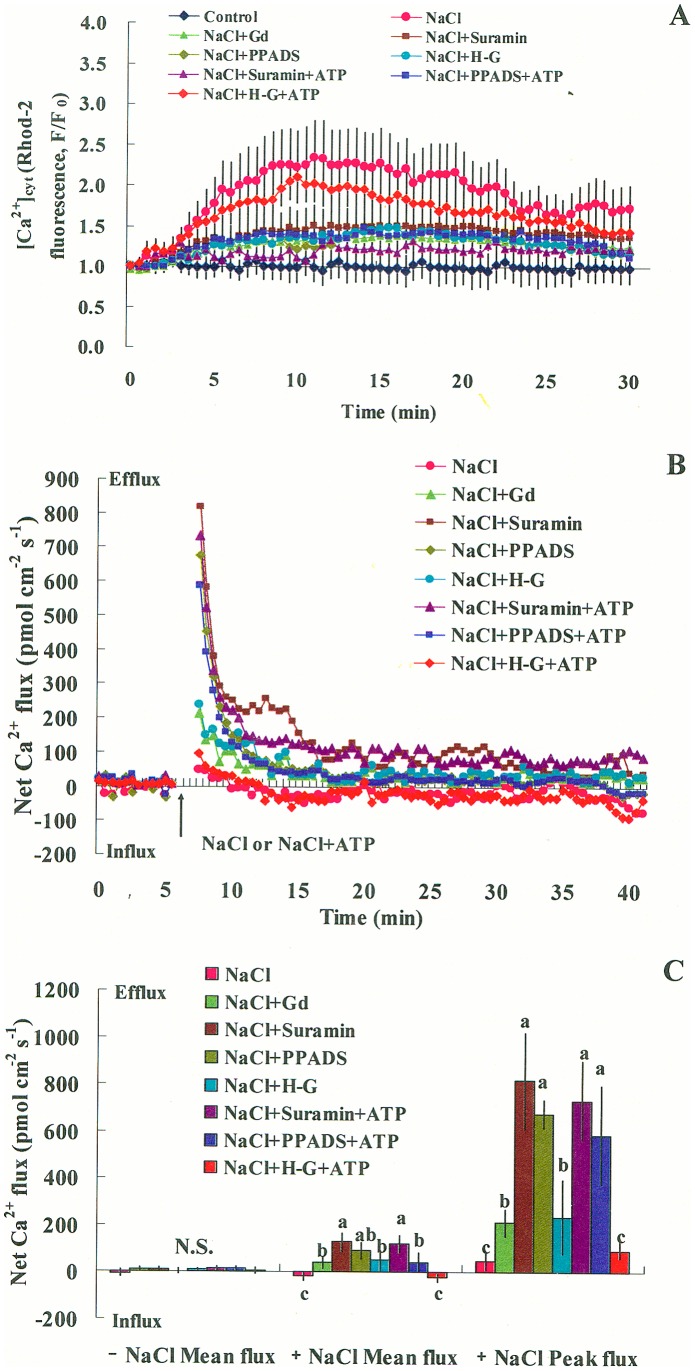
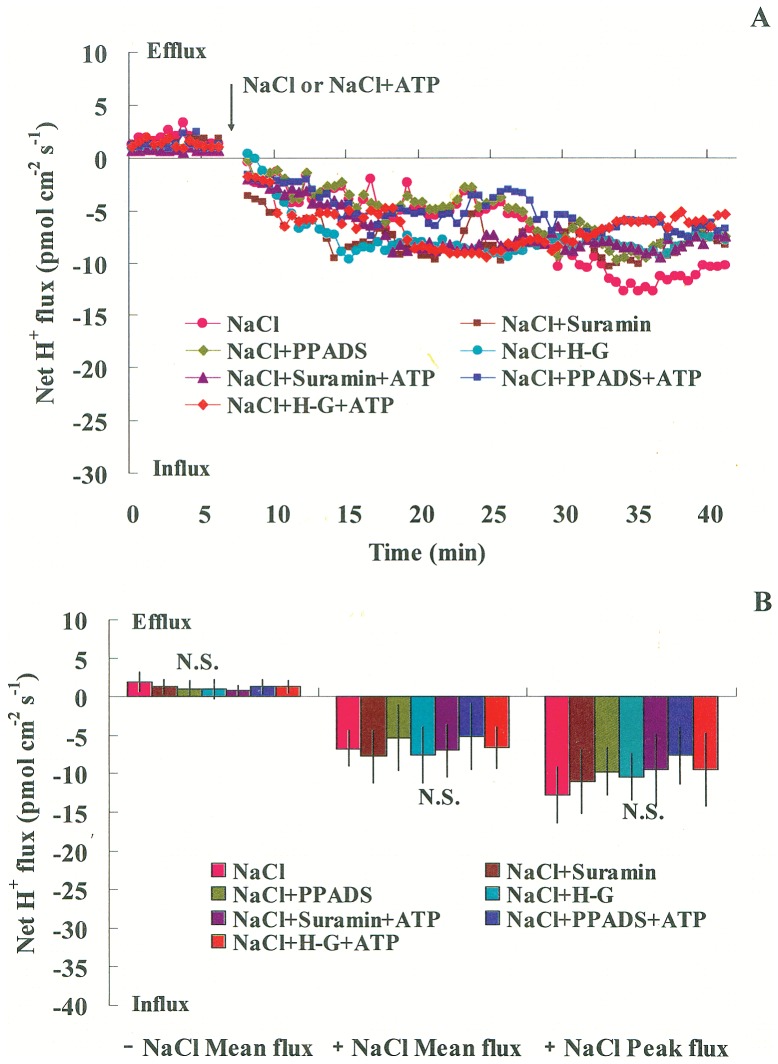
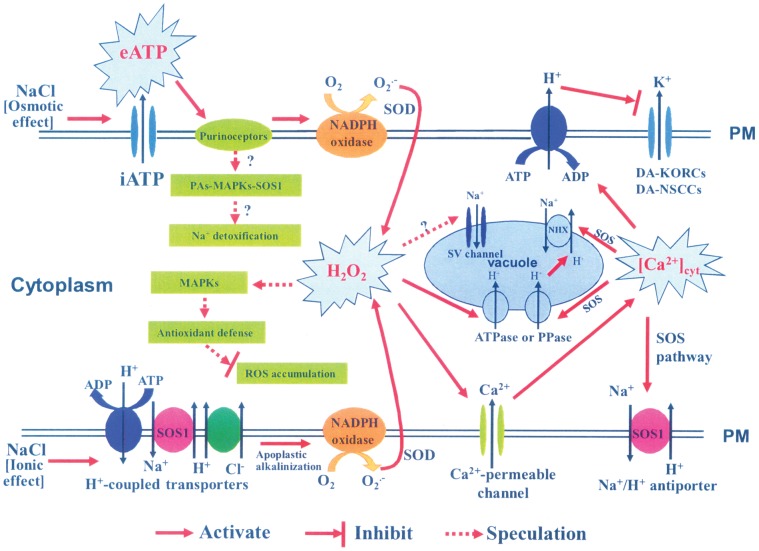
Extracellular ATP (eATP) has been implicated in mediating plant growth and antioxidant defense; however, it is largely unknown whether eATP might mediate salinity tolerance. We used confocal microscopy, a non-invasive vibrating ion-selective microelectrode, and quantitative real time PCR analysis to evaluate the physiological significance of eATP in the salt resistance of cell cultures derived from a salt-tolerant woody species, Populus euphratica. Application of NaCl (200 mM) shock induced a transient elevation in [eATP]. We investigated the effects of eATP by blocking P2 receptors with suramin and PPADS and applying an ATP trap system of hexokinase-glucose. We found that eATP regulated a wide range of cellular processes required for salt adaptation, including vacuolar Na⁺ compartmentation, Na⁺/H⁺ exchange across the plasma membrane (PM), K⁺ homeostasis, reactive oxygen species regulation, and salt-responsive expression of genes related to Na⁺/H⁺ homeostasis and PM repair. Furthermore, we found that the eATP signaling was mediated by H₂O₂ and cytosolic Ca²⁺ released in response to high salt in P. euphratica cells. We concluded that salt-induced eATP was sensed by purinoceptors in the PM, and this led to the induction of downstream signals, like H₂O₂ and cytosolic Ca²⁺, which are required for the up-regulation of genes linked to Na⁺/H⁺ homeostasis and PM repair. Consequently, the viability of P. euphratica cells was maintained during a prolonged period of salt stress.


Conflict of interest statement

Competing Interests: The authors have declared that no competing interests exist.

Figures

Figure 1
Figure 1. Extracellular ATP levels in P. euphratica cells under NaCl stress.
Time courses of ATP release in response to high NaCl (200 mM), in the presence or absence of P2 receptor antagonists (suramin or PPADS, 300 μΜ) or an ATP trap (H-G system, 50 mM glucose and 100 units/mL hexokinase). Bars represent the means from five independent experiments and whiskers represent the error of the mean.
Figure 2
Figure 2. Effects of pharmacological agents, glucose, and ATP on NaCl stress-related viability.
Suspended cells, incubated with or without pharmacological agents (suramin, 300 µM; PPADS, 300 µM; and H-G, 50 mM glucose and 100 units/mL hexokinase) or glucose (50 mM), were exposed to NaCl (200 mM) or NaCl plus ATP (200 µM) for 24 h. Control cells were cultured with no addition of NaCl or any pharmacological agent. Bars represent the means of three independent experiments (in each at least 300 cells were counted). Whiskers represent the error of the mean. Different letters (a, b) denote significant differences between treatments (P<0.01).
Figure 3
Figure 3. Effects of P2 receptors antagonists on NaCl-induced Na+ compartmentation and PM Na+/H+ antiport.
P. euphratica cells were untreated (control) or treated with 200 mM NaCl with or without 200 µM ATP for 24 h in the presence or absence of suramin (300 µM), PPADS (300 µM), or the H-G system (50 mM glucose and 100 units/mL hexokinase). Then, cells were stained with the Na+-specific fluorescent probe, CoroNa-Green/AM, to detect cytosolic and vacuolar Na+ levels. Steady-state Na+ and H+ fluxes were measured with SIET. (A, B) Na+ levels within the cytoplasm (c) and vacuole (v). Bars represent the means of at least 100 individual cells quantified from three independent experiments. (C, D) Steady-state fluxes of Na+ and H+. Bars represent the mean of 11–13 individual cells from three independent experiments. (B-D) Whiskers represent the standard error of the mean. Different letters (a, b, c) denote significant differences between treatments (P<0.05).
Figure 4
Figure 4. Effects of pharmacological agents on NaCl stress-related membrane potential and steady-state and transient K+ fluxes.
(A) Membrane potential (MP). P. euphratica cells were untreated (control) or treated with 200 mM NaCl supplemented with or without 200 µM ATP for 24 h in the presence and absence of suramin (300 µM), PPADS (300 µM), or the H-G system (50 mM glucose and 100 units/mL hexokinase). Then, cells were incubated with the MP-sensitive fluorescent probe, DiBAC4(3). Values (white font) represent the mean±SD based on quantifications from at least 50–60 individual cells in three independent experiments. Different letters (a, b, c) denote significant differences between treatments (P<0.01). (B) Steady-state K+ fluxes. K+ fluxes across the PM were measured with SIET. Bars represent the mean of 15–18 individual cells and whiskers represent the standard error of the mean. Different letters (a, b, c) denote significant differences between treatments (P<0.05). (C) Transient K+ fluxes in response to NaCl (200 mM) or NaCl (200 mM) plus ATP (200 µM) in the presence and absence of suramin, PPADS, or H-G system. Each point represents the mean of six individual cells measured in three independent experiments. (D) Peak and mean values for transient K+ fluxes before (-) and after (+) the addition of NaCl or NaCl plus ATP. Bars represent the mean of six individual cells and whiskers represent the standard error of the mean. N.S. = no significant difference.
Figure 5
Figure 5. Effects of pharmacological agents on expression of salt-responsive genes in NaCl-stressed P. euphratica cells.
P. euphratica cells were untreated (control) or treated with 200 mM NaCl or NaCl plus 200 µM ATP for 24 h in the absence or presence of suramin (300 µM), PPADS (300 µM), and the H-G system (50 mM glucose and 100 units/mL hexokinase); then, total RNA was isolated for quantitative Real-Time PCR analysis. Bars represent the mean of four replicates and whiskers represent the standard error of the mean. Different letters (a, b, c, d) denote significant differences between treatments (P<0.05).
Figure 6
Figure 6. Effects of pharmacological agents and ATP on H2O2 production in P. euphratica cells under NaCl stress.
(A) H2O2 accumulation after 24 h of salt stress. Suspended cells, incubated with or without pharmacological agents (suramin, 300 µM; PPADS, 300 µM; and H-G, 50 mM glucose and 100 units/mL hexokinase) or glucose (50 mM), were exposed to NaCl (200 mM) or NaCl plus ATP (200 µM) for 24 h. Control cells were cultured with no addition of NaCl or any pharmacological agent. Bars represent the means of three independent experiments (in each 45 to 50 individual cells were quantified). Whiskers represent the error of the mean. Different letters (a, b, c) denote significant differences between treatments (P<0.01). (B) Early H2O2 production upon salt shock. Suspended cells were untreated (control) or pretreated without or with DPI (100 µM for 30 min), suramin (300 µM for 2 h), PPADS (300 µM for 2 h), or the H-G system (50 mM glucose and 100 units/mL hexokinase for 6 h), followed by exposure to NaCl (200 mM) with or without ATP (200 µM) supplementation. Transient production of H2O2 was recorded under a confocal microscope. Each point represents the mean of 15 to 18 individual cells from four independent experiments. Inserted panels show the H2DCF-dependent fluorescence intensity after 20–25 min of treatment. Different letters (a, b, c) denote significant differences between treatments (P<0.01).
Figure 7
Figure 7. Effects of pharmacological agents on NaCl stress-induced [Ca2+]cyt and Ca2+ flux in P. euphratica cells.
Suspended cells were untreated or treated with NaCl (200 mM) or NaCl plus ATP (200 µM) in the presence or absence of suramin (300 µM), PPADS (300 µM), the H-G system (50 mM glucose and 100 units/mL hexokinase), or GdCl3 (500 µM). (A) Transient [Ca2+]cyt. Rhod-2/AM fluorescence intensity was measured in the cytoplasm before (F0) and after (F) the treatments. Each point represents the mean of 12 to 15 individual cells from four independent experiments. (B) Transient Ca2+ fluxes. Symbols are representative of five to six independent experiments. (C) Peak and mean flux rates of Ca2+ before (-) and after (+) the addition of NaCl or NaCl plus ATP. Bars represent the mean of five to six individual cells, and whiskers represent the standard error of the mean. Different letters (a, b, c) denote significant differences between treatments (P<0.05). N.S. = no significant difference.
Figure 8
Figure 8. Effects of pharmacological agents on NaCl stress-induced H+ flux across the plasma membrane.
P. euphratica cells were untreated (control) or treated with NaCl (200 mM) or NaCl plus ATP (200 µM) in the presence or absence of suramin (300 µM), PPADS (300 µM), or the H–G system (50 mM glucose and 100 units/mL hexokinase). (A) Transient H+ flux. SIET data are representative of six independent experiments. (B) Peak and mean values of H+ fluxes before (–) and after (+) the addition of NaCl or NaCl plus ATP. Bars represent the mean of six individual cells, and whiskers represent the standard error of the mean. N.S. = no significant difference.
Figure 9
Figure 9. Schematic model shows proposed eATP signals that mediate the NaCl stress response in P. euphratica cells.
The top line (PM = double line) indicates the molecules involved in the osmotic sensor and associated responses to salt stress. The bottom line (PM = double line) indicates the molecules involved in the ionic sensor and associated responses to salt stress (see text for details). These sensors are separated in this diagram for clarity, but they are not expected to be relegated to separate compartments on the cell membrane.

Similar articles

Cited by

References

    1. Zhang F, Wang Y, Yang YL, Wu H, Wang D, et al. (2007) Involvement of hydrogen peroxide and nitric oxide in salt resistance in the calluses from Populus euphratica. . Plant Cell Environ 30: 775–785. - PubMed
    1. Chung JS, Zhu JK, Bressan RA, Hasegawa PM, Shi H (2008) Reactive oxygen species mediate Na+-induced SOS1 mRNA stability in Arabidopsis. Plant J 53: 554–565. - PMC - PubMed
    1. Tracy FE, Gilliham M, Dodd AN, Webb AAR, Tester M (2008) NaCl-induced changes in cytosolic free Ca2+ in Arabidopsis thaliana are heterogeneous and modified by external ionic composition. Plant Cell Environ 31: 1063–1073. - PubMed
    1. Sun J, Wang M, Ding M, Deng S, Liu M, et al. (2010) H2O2 and cytosolic Ca2+ signals triggered by the PM H+-coupled transport system mediate K+/Na+ homeostasis in NaCl-stressed Populus euphratica cells. Plant Cell Environ 33: 943–958. - PubMed
    1. Sun J, Li L, Liu M, Wang M, Ding M, et al. (2010) Hydrogen peroxide and nitric oxide mediate K+/Na+ homeostasis and antioxidant defense in NaCl-stressed callus cells of two contrasting poplars. Plant Cell Tiss Organ Cult 103: 205–215.

Publication types

MeSH terms