. 2013 Jan 30;135(4):1358-68.
doi: 10.1021/ja3084972. Epub 2013 Jan 22.

Multidimensional magic angle spinning NMR spectroscopy for site-resolved measurement of proton chemical shift anisotropy in biological solids

Affiliations

Multidimensional magic angle spinning NMR spectroscopy for site-resolved measurement of proton chemical shift anisotropy in biological solids

Guangjin Hou et al. J Am Chem Soc. .

Abstract

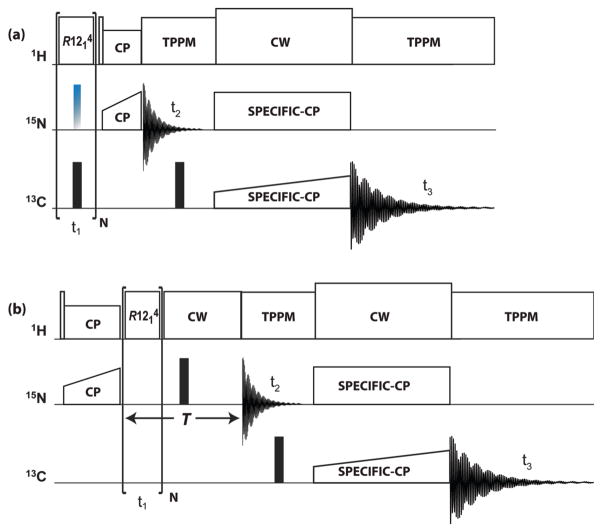
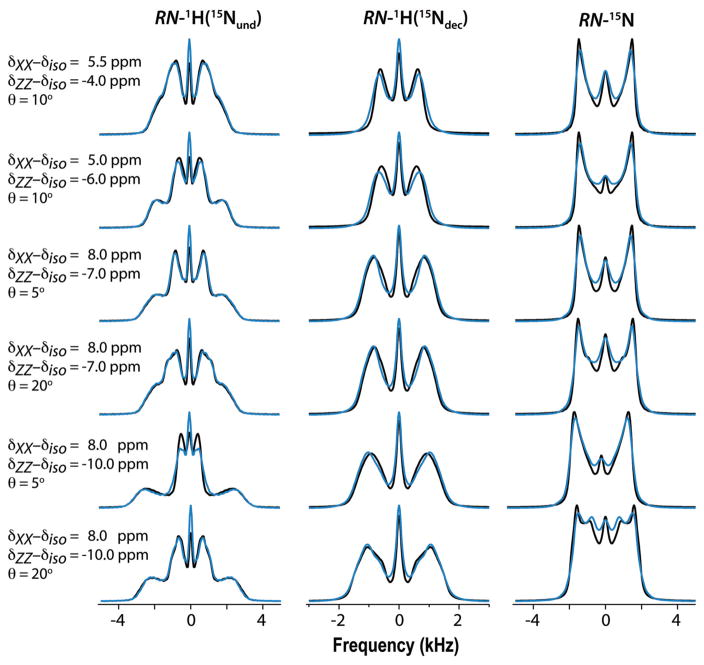
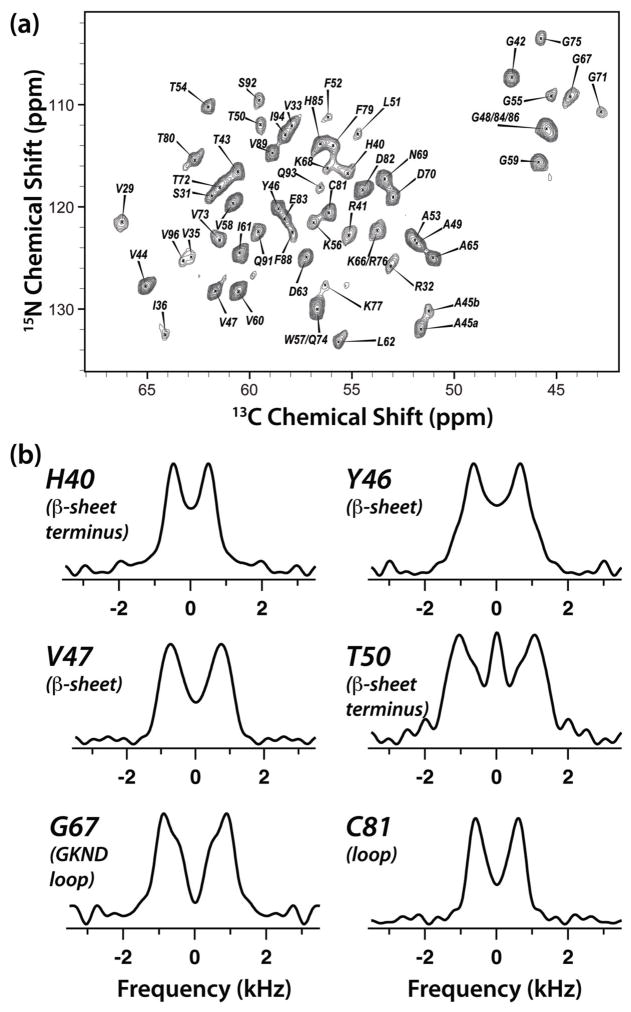
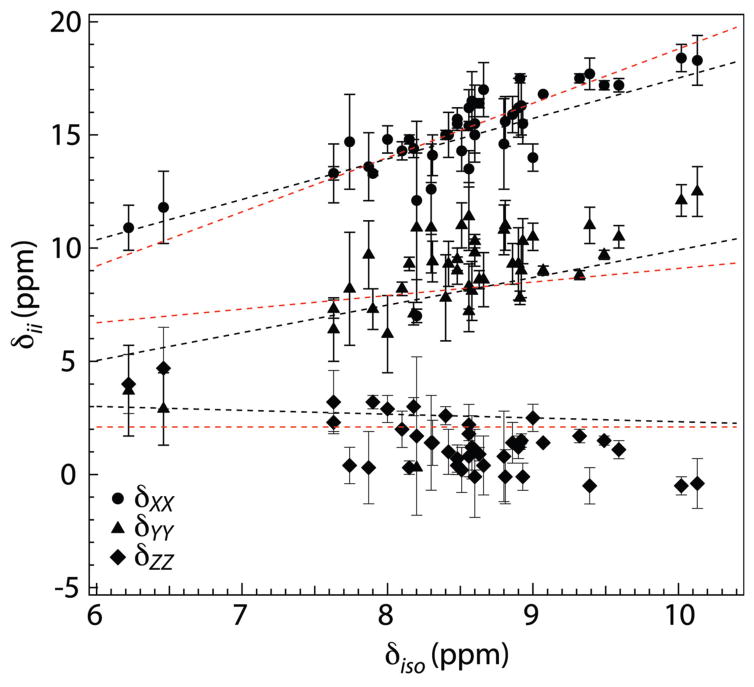
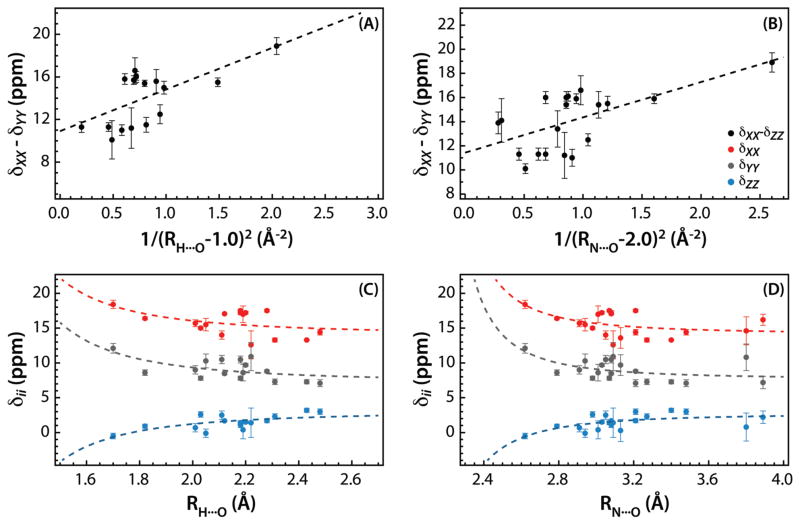
The proton chemical shift (CS) tensor is a sensitive probe of structure and hydrogen bonding. Highly accurate quantum-chemical protocols exist for computation of (1)H magnetic shieldings in the various contexts, making proton chemical shifts potentially a powerful predictor of structural and electronic properties. However, (1)H CS tensors are not yet widely used in protein structure calculation due to scarcity of experimental data. While isotropic proton shifts can be readily measured in proteins even in the solid state, determination of the (1)H chemical shift anisotropy (CSA) tensors remains challenging, particularly in molecules containing multiple proton sites. We present a method for site-resolved measurement of amide proton CSAs in fully protonated solids under magic angle spinning. The approach consists of three concomitant 3D experiments yielding spectra determined by either mainly (1)H CSA, mainly (1)H–(15)N dipolar, or combined (1)H CSA and (1)H–(15)N dipolar interactions. The anisotropic interactions are recoupled using RN-sequences of appropriate symmetry, such as R12(1)(4), and (15)N/(13)C isotropic CS dimensions are introduced via a short selective (1)H–(15)N cross-polarization step. Accurate (1)H chemical shift tensor parameters are extracted by simultaneous fit of the lineshapes recorded in the three spectra. An application of this method is presented for an 89-residue protein, U-(13)C,(15)N-CAP-Gly domain of dynactin. The CSA parameters determined from the triple fits correlate with the hydrogen-bonding distances, and the trends are in excellent agreement with the prior solution NMR results. This approach is generally suited for recording proton CSA parameters in various biological and organic systems, including protein assemblies and nucleic acids.


Figures

Figure 1
Figure 1
Pulse sequences for (a) RN-1H(15Nund) and RN-1H(15Ndec), and (b) RN-15N 3D experiments. Rotor synchronized R1214 symmetry rf pulses are applied during t1 evolution time to reintroduce 1H CSA or 1H-15N dipolar interactions under MAS conditions. Empty and solid rectangles denote π/2 and π pulses, respectively. In (a) the time dependence of 1H z-magnetization is monitored, either with application of the 15N decoupling π pulses (RN-1H(15Ndec)) or without (RN-1H(15Nund)). This optional decoupling pulse is colored in blue-grey. Site selective 1H detection is accomplished by short-contact-time CP to 15N. In (b) the time evolution of 15N x-magnetization is monitored with refocusing of the chemical shift over a constant evolution period T. 15N-13C SPECIFIC-CP magnetization transfer is introduced following the t2 evolution period, with the subsequent detection of the 13C signal during the t3.
Figure 2
Figure 2
(a) Orientation of the CSA principal axes XYZ in the molecular frame of a hydrogen-bonded amide group. (b) Relative orientations of the NH bond vector and the CSA axes XYZ. (c) Relative orientations of the magnetic field B0, the rotor axis, and the CSA principal axes XYZ of a single crystal, depicted at the moment in the rotor cycle at which the rotation angle is zero (see text); χm is the magic angle.
Figure 3
Figure 3
Simulated R1214 spectra evaluated with D = 10 kHz and indicated principal components δXXδiso and δZZδiso of the 1H CSA tensor (δYYδiso is not indicated as it is equal to minus the sum of the other two components) and polar angles θ of the NH vector. The azimuthal angle φ is constant at 45°. Black: Calculated with average Hamiltonians. Blue: Calculated with full R1214 Hamiltonian including three nearby protons. Other parameters: 1H Larmor frequency 850 MHz, MAS frequency 14 kHz, 64 R1214 time-domain increments of 1/14 ms for RN-1H(15Nund) and RN-15N spectra and 2/14 ms for RN-1H(15Ndec) spectra, 2/14 ms CP contact time, and 200 Hz Lorentzian line broadening. Number of crystallite orientations and γ angles are 320 and 4, respectively.
Figure 4
Figure 4
(a) The 2D NCA plane (at t1 = 0) of the 3D R1214-1H(15Ndec) spectrum of U-13C,15N-CAP-Gly domain of mammalian dynactin. The experiment was conducted at 19.9 T. Acquisition and processing parameters are presented in the Experiment section. (b) Experimental RN-1H(15Ndec) lineshapes extracted from the 3D RN-1H(15Ndec) spectrum for judiciously chosen CAP-Gly residues: H40 (terminus of β-sheet), Y46 (β-sheet), V47 (β-sheet), T50 (loop), T54 (loop), and C81 (loop).
Figure 5
Figure 5
Experimental (black) and best-fit simulated with full Hamiltonian (blue) R1214 -symmetry based RN-1H(15Nund), RN-1H(15Ndec), and RN-15N lineshapes of select residues of U-13C,15N-CAP-Gly domain of mammalian dynactin.
Figure 6
Figure 6
Principal components of 1H CSA tensors observed for 42 residues of U-13C,15N-CAP-Gly domain of mammalian dynactin, plotted as a function of the isotropic 1H chemical shifts: δXX (circles), δYY (traingles), and δZZ (diamonds). The straight lines represent the linear regression through similar CS plots of ubiquitin by Loth et al. (red: δXX = 2.4δiso − 5.2 ppm; δYY = 0.6δiso + 3.1 ppm; δZZ = 2.1 ppm) and of GB3 by Yao et al. (black: δXX = 1.79δiso − 0.38 ppm; δYY = 1.22δiso − 2.28 ppm; δZZ = −0.17δiso + 4.03 ppm). The three best fit lines through our experimental data are (not shown): δXX = 2.0δiso − 1.7 ppm (RP = 0.85, p = 4.3×10⁻¹³); δYY = 2.0δiso − 8.3 ppm (RP = 0.78, p = 7.5×10⁻¹⁰); δZZ = −1.04δiso + 10.2 ppm (RP = −0.65, p = 3.3×10⁻⁶).
Figure 7
Figure 7
Correlation between principal components of 1H CSA tensors and hydrogen bond length in U-13C,15N-CAP-Gly domain of mammalian dynactin. (A) and (B) show the correlation between the span, δXXZZ (black) and the HO and NO distance, respectively. In (C) and (D), correlations of the principal components δXX (red), δYY (grey), and δZZ (blue) are shown with the HO and NO distance, respectively. The HO and NO distances are extracted from the MAS NMR structure of CAP-Gly (PDB code 2m02). The dashed lines in (A)–(D) correspond to equation (7). In (A), B = 10.9 ppm, C = 3.9 ppm Å2, and D = 1.0 Å2. The Pearson correlation coefficient R = 0.63, and the statistical significance p = 0.007. In (B), B = 11.5 ppm, C = 2.6 ppm Å2, and D = 2.0 Å2. The Pearson correlation coefficient R = 0.61, and the statistical significance p = 0.0046. The dotted lines in (C) and (D) represent the fits of the principal components of the CSA tensors to equation (7) with the fixed values of coefficient D (1.0 Å2 and 2.0 Å2 for HO and NO distances, respectively). In (C), the Pearson coefficient R and the statistical significance p are 0.48/0.05, 0.60/0.01, and −0.69/0.002 for δXX, δYY, and δZZ, respectively. In (D), the corresponding parameters are 0.48/0.03, 0.51/0.02, and −0.60/0.005.

References

    1. Grant DM. In: Encyclopedia of Magnetic Resonance. Harris KDM, Wasylishen R, editors. Wiley; Chichester: 1996.
    1. McDermott A, Ridenour CF. In: Encyclopedia of Magnetic Resonance. Grant DM, editor. Wiley; Chichester: 1996.
    1. Konrat R, Tollinger M, Kontaxis G, Krautler B. Monatsh Chem. 1999;130:961–982.
    1. Saito H, Ando I, Ramamoorthy A. Prog Nucl Magn Reson Spectrosc. 2010;57:181–228. - PMC - PubMed
    1. Berglund B, Vaughan RW. J Chem Phys. 1980;73:2037–2043.

Publication types

LinkOut - more resources