

Quantitative low mechanical index contrast-enhanced endoscopic ultrasound for the differential diagnosis of chronic pseudotumoral pancreatitis and pancreatic cancer
- PMID: 23286918
- PMCID: PMC3548695
- DOI: 10.1186/1471-230X-13-2
Quantitative low mechanical index contrast-enhanced endoscopic ultrasound for the differential diagnosis of chronic pseudotumoral pancreatitis and pancreatic cancer
Abstract
Background: Second-generation intravenous blood-pool ultrasound contrast agents are increasingly used in endoscopic ultrasound (EUS) for characterization of microvascularization, differential diagnosis of benign and malignant focal lesions, as well as improved staging and guidance of therapeutic procedures.
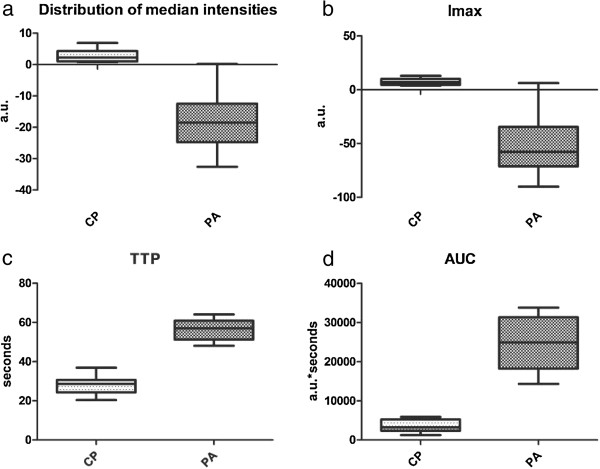
Methods: The aim of our study was to prospectively compare the vascularisation patterns in chronic pseudotumoral pancreatitis and pancreatic cancer using quantitative low mechanical index (MI) contrast-enhanced EUS. We included 51 patients with chronic pseudotumoral pancreatitis (n = 19) and pancreatic cancer (n = 32). Perfusion imaging started with a bolus injection of Sonovue (2.4 ml), followed by analysis in the early arterial (wash-in) and late venous (wash-out) phase. Perfusion analysis was performed by post-processing of the raw data (time intensity curve [TIC] analysis). TIC analysis was performed inside the tumor and the pancreatic parenchyma, with depiction of the dynamic vascular pattern generated by specific software. Statistical analysis was performed on raw data extracted from the TIC analysis. Final diagnosis was based on a combination of EUS-FNA, surgery and follow-up of minimum 6 months in negative cases.
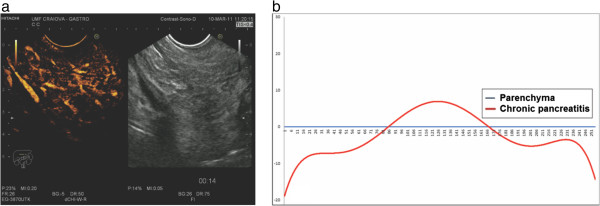
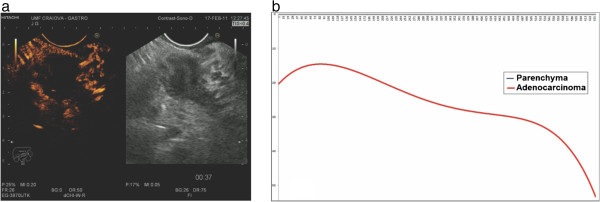
Results: The sensitivity and specificity of low MI contrast enhanced EUS using TIC were sensitivity and specificity of low MI contrast enhanced EUS using TIC analysis were 93.75% (95% CI = 77.77-98.91%) and 89.47% (95% CI = 65.46-98.15%), respectively. Pseudotumoral chronic pancreatitis showed in the majority of cases a hypervascular appearance in the early arterial phase of contrast-enhancement, with a dynamic enhancement pattern similar with the rest of the parenchyma. Statistical analysis of the resulting series of individual intensities revealed no statistically relevant differences (p = .78). Pancreatic adenocarcinoma was usually a hypovascular lesion, showing low contrast-enhancement during the early arterial and also during the late venous phase of contrast-enhancement, also lower than the normal surrounding parenchyma. We found statistically significant differences in values during TIC analysis (p < .001).
Conclusions: Low MI contrast enhanced EUS technique is expected to improve the differential diagnosis of focal pancreatic lesions. However, further multicentric randomized studies will confirm the exact role of the technique and its place in imaging assessment of focal pancreatic lesions.
Figures
Similar articles
-
Quantitative contrast-enhanced harmonic endoscopic ultrasonography for the discrimination of solid pancreatic masses.Ultraschall Med. 2010 Dec;31(6):571-6. doi: 10.1055/s-0029-1245833. Epub 2010 Nov 15. Ultraschall Med. 2010. PMID: 21080306
-
Endoscopic ultrasound and fine needle aspiration in chronic pancreatitis: differential diagnosis between pseudotumoral masses and pancreatic cancer.JOP. 2007 Jul 9;8(4):413-21. JOP. 2007. PMID: 17625292
-
Quantitative contrast-enhanced harmonic EUS in differential diagnosis of focal pancreatic masses (with videos).Gastrointest Endosc. 2015 Jul;82(1):59-69. doi: 10.1016/j.gie.2014.11.040. Epub 2015 Mar 16. Gastrointest Endosc. 2015. PMID: 25792386
-
Contrast-enhanced harmonic endoscopic ultrasound.Endoscopy. 2012 Jun;44(6):612-7. doi: 10.1055/s-0032-1308909. Epub 2012 Apr 23. Endoscopy. 2012. PMID: 22528674 Review.
-
The role of EUS in relation to other imaging modalities in the differential diagnosis between mass forming chronic pancreatitis, autoimmune pancreatitis and ductal pancreatic adenocarcinoma.Rev Esp Enferm Dig. 2012 Jun;104(6):315-21. doi: 10.4321/s1130-01082012000600006. Rev Esp Enferm Dig. 2012. PMID: 22738702 Review.
Cited by
-
Comparison of the Color Doppler Vascularity Index in Patients with Pancreatic Adenocarcinoma and Chronic Pancreatitis from a Single Center in Poland.Med Sci Monit. 2022 Feb 22;28:e935249. doi: 10.12659/MSM.935249. Med Sci Monit. 2022. PMID: 35190521 Free PMC article.
-
Instant evaluation of contrast enhanced endoscopic ultrasound helps to differentiate various solid pancreatic lesions in daily routine.World J Clin Cases. 2019 Jan 6;7(1):19-27. doi: 10.12998/wjcc.v7.i1.19. World J Clin Cases. 2019. PMID: 30637249 Free PMC article.
-
Impact of endoscopic ultrasonography on diagnosis of pancreatic cancer.J Gastroenterol. 2019 Jan;54(1):19-32. doi: 10.1007/s00535-018-1519-2. Epub 2018 Nov 7. J Gastroenterol. 2019. PMID: 30406288 Free PMC article. Review.
-
Assessment of biological effect of nab-paclitaxel combined with gemcitabine, using contrast enhanced ultrasonography and elastography, in advanced pancreatic ductal carcinoma: A single-center pilot study.Endosc Ultrasound. 2023 Mar-Apr;12(2):273-276. doi: 10.4103/EUS-D-22-00040. Endosc Ultrasound. 2023. PMID: 37148140 Free PMC article.
-
Automatic Segmentation of Pancreatic Tumors Using Deep Learning on a Video Image of Contrast-Enhanced Endoscopic Ultrasound.J Clin Med. 2021 Aug 15;10(16):3589. doi: 10.3390/jcm10163589. J Clin Med. 2021. PMID: 34441883 Free PMC article.
References
-
- Hocke M, Ignee A, Dietrich CF. Advanced endosonographic diagnostic tools for discrimination of focal chronic pancreatitis and pancreatic carcinoma–elastography, contrast enhanced high mechanical index (CEHMI) and low mechanical index (CELMI) endosonography in direct comparison. Z Gastroenterol. 2012;50:199–203. - PubMed
-
- Săftoiu A, Dietrich CF, Vilmann P. Contrast-enhanced harmonic endoscopic ultrasound. Endoscopy. 2012;44:612–617. - PubMed
Publication types
MeSH terms
LinkOut - more resources
Full Text Sources
Other Literature Sources
Medical
