

Influence of DNA repair on nonlinear dose-responses for mutation
- PMID: 23288051
- PMCID: PMC3576011
- DOI: 10.1093/toxsci/kfs341
Influence of DNA repair on nonlinear dose-responses for mutation
Abstract
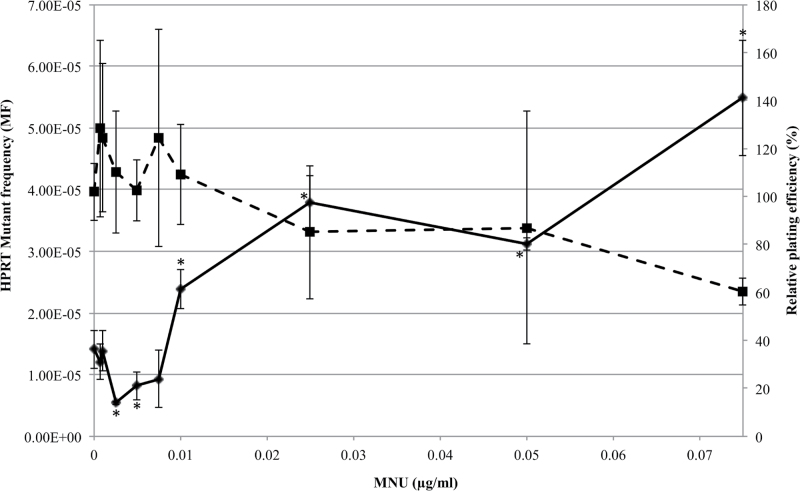
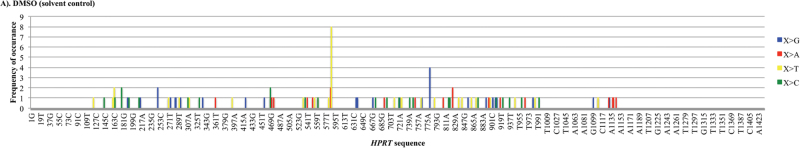
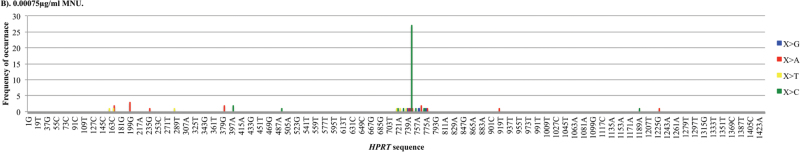
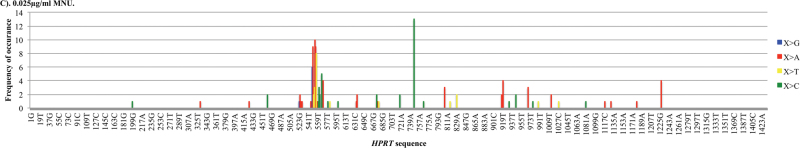
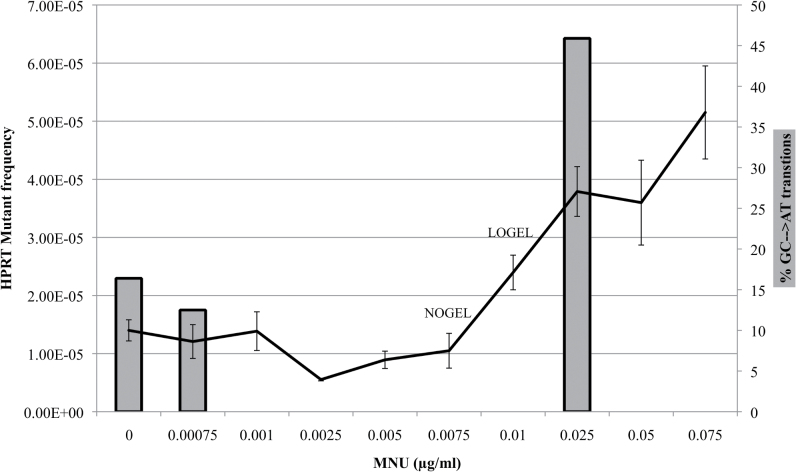
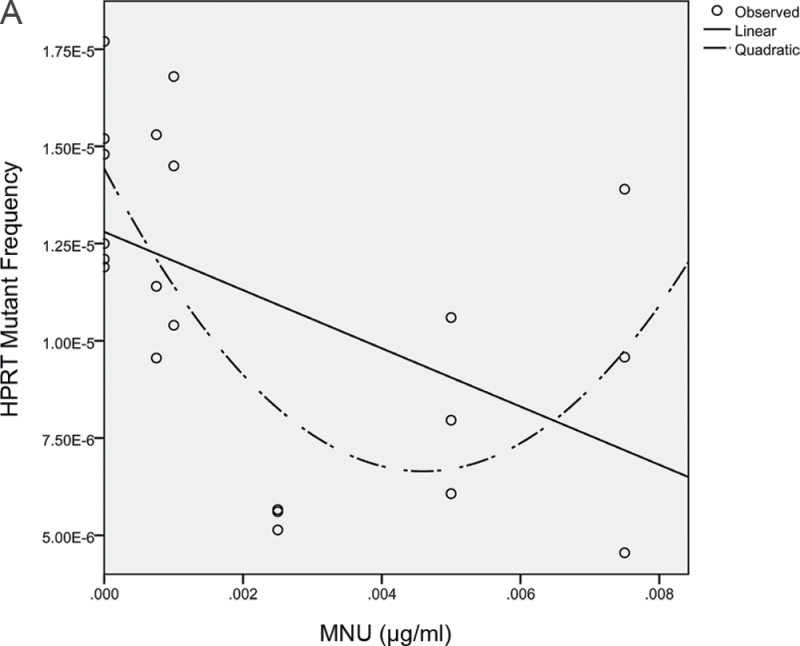
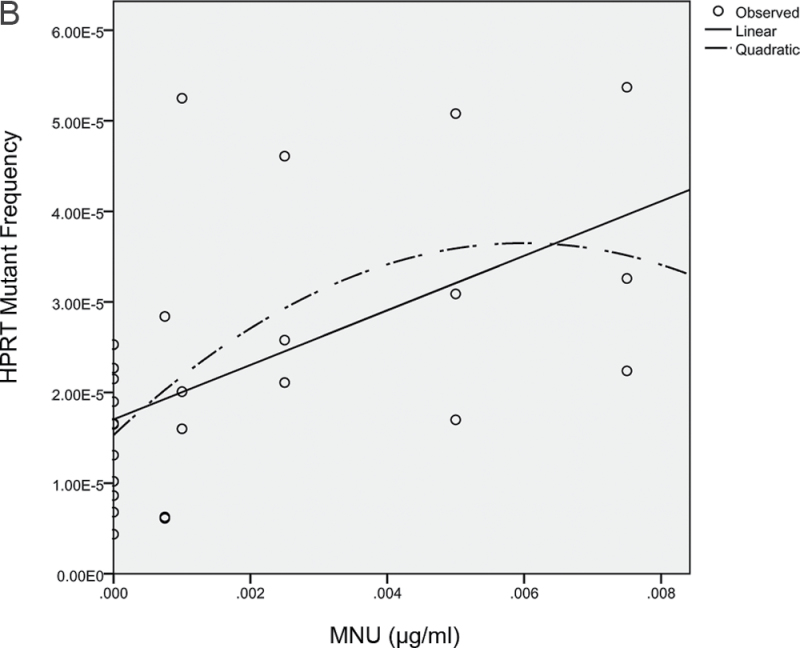
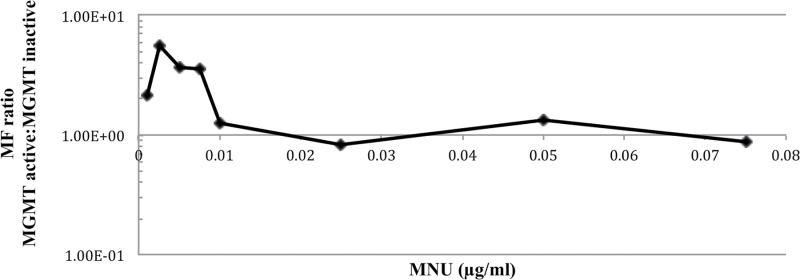
Recent evidence has challenged the default assumption that all DNA-reactive alkylating agents exhibit a linear dose-response. Emerging evidence suggests that the model alkylating agents methyl- and ethylmethanesulfonate and methylnitrosourea (MNU) and ethylnitrosourea observe a nonlinear dose-response with a no observed genotoxic effect level (NOGEL). Follow-up mechanistic studies are essential to understand the mechanism of cellular tolerance and biological relevance of such NOGELs. MNU is one of the most mutagenic simple alkylators. Therefore, understanding the mechanism of mutation induction, following low-dose MNU treatment, sets precedence for weaker mutagenic alkylating agents. Here, we tested MNU at 10-fold lower concentrations than a previous study and report a NOGEL of 0.0075 µg/ml (72.8nM) in human lymphoblastoid cells, quantified through the hypoxanthine (guanine) phosphoribosyltransferase assay (OECD 476). Mechanistic studies reveal that the NOGEL is dependent upon repair of O(6)-methylguanine (O(6)MeG) by the suicide enzyme O(6)MeG-DNA methyltransferase (MGMT). Inactivation of MGMT sensitizes cells to MNU-induced mutagenesis and shifts the NOGEL to the left on the dose axis.
Figures
Similar articles
-
Modulation of N-Methyl-N-nitrosourea Mutagenesis in Mouse Embryo Fibroblasts Derived from the gpt Delta Mouse by an Inhibitor of the O6-Methylguanine Methyltransferase, MGMT.Chem Res Toxicol. 2020 Feb 17;33(2):625-633. doi: 10.1021/acs.chemrestox.9b00444. Epub 2019 Dec 24. Chem Res Toxicol. 2020. PMID: 31841318 Free PMC article.
-
The L84F polymorphism in the O6-Methylguanine-DNA-Methyltransferase (MGMT) gene is associated with increased hypoxanthine phosphoribosyltransferase (HPRT) mutant frequency in lymphocytes of tobacco smokers.Pharmacogenet Genomics. 2007 Sep;17(9):743-53. doi: 10.1097/FPC.0b013e3281111eb1. Pharmacogenet Genomics. 2007. PMID: 17700363
-
Mechanistic influences for mutation induction curves after exposure to DNA-reactive carcinogens.Cancer Res. 2007 Apr 15;67(8):3904-11. doi: 10.1158/0008-5472.CAN-06-4061. Cancer Res. 2007. PMID: 17440105
-
MGMT: key node in the battle against genotoxicity, carcinogenicity and apoptosis induced by alkylating agents.DNA Repair (Amst). 2007 Aug 1;6(8):1079-99. doi: 10.1016/j.dnarep.2007.03.008. Epub 2007 May 7. DNA Repair (Amst). 2007. PMID: 17485253 Review.
-
Genotoxic thresholds, DNA repair, and susceptibility in human populations.Toxicology. 2010 Dec 30;278(3):305-10. doi: 10.1016/j.tox.2009.11.016. Epub 2009 Nov 22. Toxicology. 2010. PMID: 19932733 Review.
Cited by
-
A threshold of endogenous stress is required to engage cellular response to protect against mutagenesis.Sci Rep. 2016 Jul 11;6:29412. doi: 10.1038/srep29412. Sci Rep. 2016. PMID: 27406380 Free PMC article.
-
Setting Occupational Exposure Limits for Genotoxic Substances in the Pharmaceutical Industry.Toxicol Sci. 2016 May;151(1):2-9. doi: 10.1093/toxsci/kfw028. Toxicol Sci. 2016. PMID: 27207978 Free PMC article. Review.
-
Biological Basis for Threshold Responses to Methylating Agents.Chem Res Toxicol. 2020 Sep 21;33(9):2219-2224. doi: 10.1021/acs.chemrestox.0c00052. Epub 2020 May 27. Chem Res Toxicol. 2020. PMID: 32388971 Free PMC article. Review.
-
Synergistic and Antagonistic Mutation Responses of Human MCL-5 Cells to Mixtures of Benzo[a]pyrene and 2-Amino-1-Methyl-6-Phenylimidazo[4,5-b]pyridine: Dose-Related Variation in the Joint Effects of Common Dietary Carcinogens.Environ Health Perspect. 2016 Jan;124(1):88-96. doi: 10.1289/ehp.1409557. Epub 2015 Jun 19. Environ Health Perspect. 2016. PMID: 26091049 Free PMC article.
-
Goodbye to the bioassay.Toxicol Res (Camb). 2018 Feb 6;7(4):558-564. doi: 10.1039/c8tx00004b. eCollection 2018 Jul 1. Toxicol Res (Camb). 2018. PMID: 30090606 Free PMC article. Review.
References
-
- Adams W. T., Skopek T. R. (1987). Statistical test for the comparison of samples from mutational spectra. J. Mol. Biol. 194, 391–396 - PubMed
-
- Becker K., Dosch J., Gregel C. M., Martin B. A., Kaina B. (1996). Targeted expression of human O(6)-methylguanine-DNA methyltransferase (MGMT) in transgenic mice protects against tumor initiation in two-stage skin carcinogenesis. Cancer Res. 56, 3244–3249 - PubMed
-
- Beranek D. T. (1990). Distribution of methyl and ethyl adducts following alkylation with monofunctional alkylating agents. Mutat. Res. 231, 11–30 - PubMed
-
- Beranek D. T., Heflich R. H., Kodell R. L., Morris S. M., Casciano D. A. (1983). Correlation between specific DNA-methylation products and mutation induction at the HGPRT locus in Chinese hamster ovary cells. Mutat. Res. 110, 171–180 - PubMed
Publication types
MeSH terms
Substances
LinkOut - more resources
Full Text Sources
Other Literature Sources
Research Materials
