. 2013 Mar;132(1):53-63.
doi: 10.1093/toxsci/kfs342. Epub 2013 Jan 3.

Molecular mechanisms of fibrosis-associated promotion of liver carcinogenesis

Affiliations

Molecular mechanisms of fibrosis-associated promotion of liver carcinogenesis

Takeki Uehara et al. Toxicol Sci. 2013 Mar.

Abstract

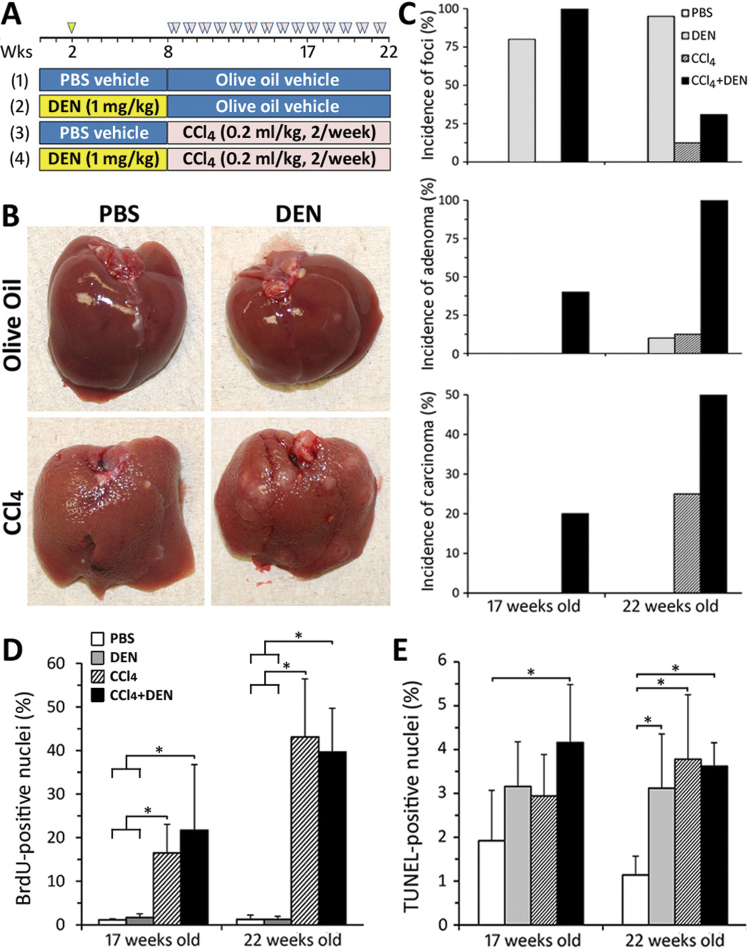
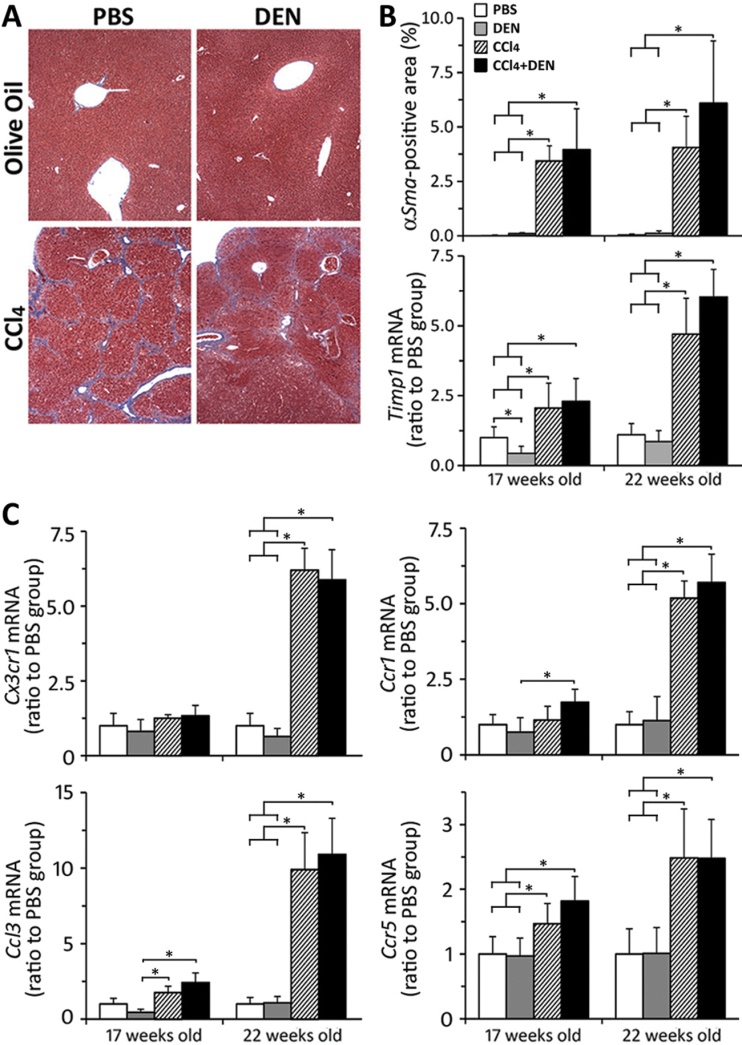
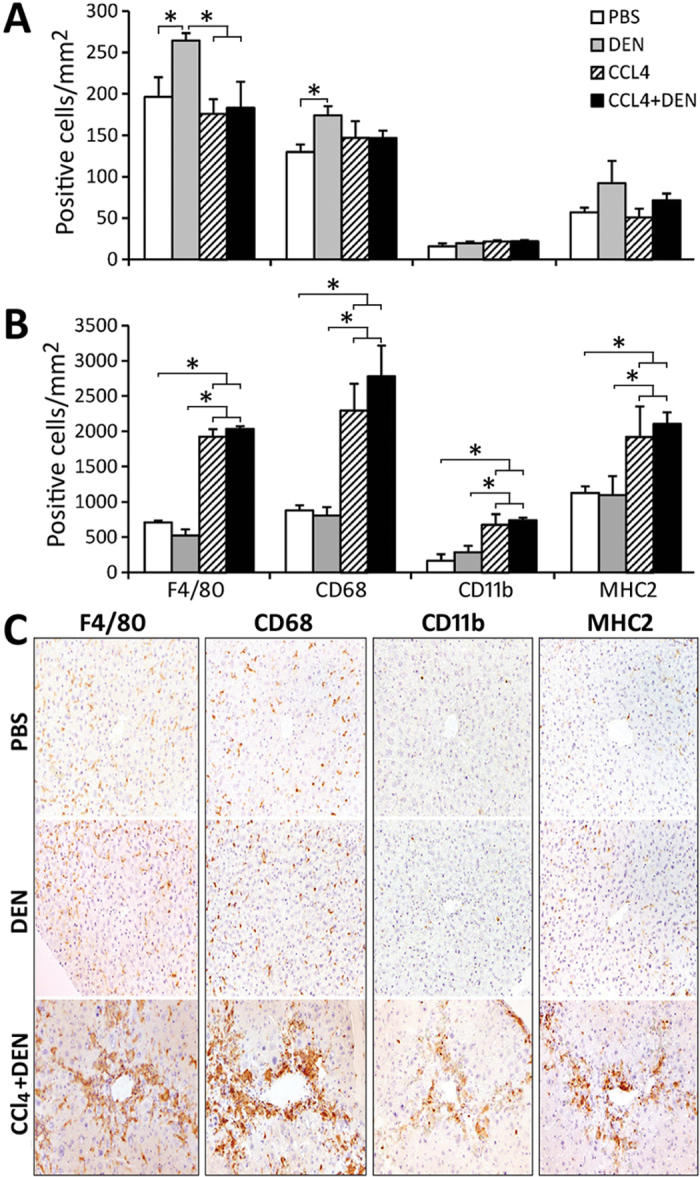
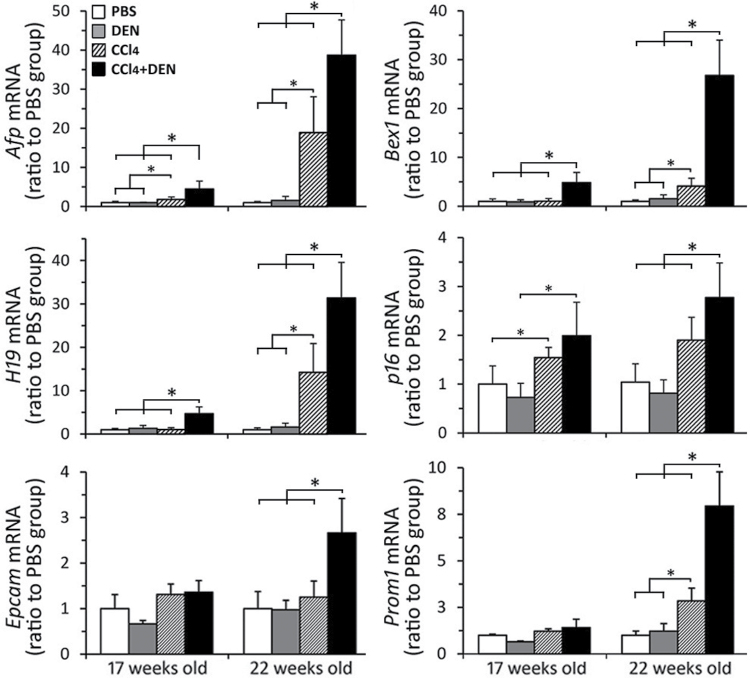
Hepatocellular carcinoma (HCC) mostly develops in patients with advanced fibrosis; however, the mechanisms of interaction between a genotoxic insult and fibrogenesis are not well understood. This study tested a hypothesis that fibrosis promotes HCC via a mechanism that involves activation of liver stem cells. First, B6C3F1 mice were administered diethylnitrosamine (DEN; single ip injection of 1mg/kg at 14 days of age). Second, carbon tetrachloride (CCl(4); 0.2ml/kg, 2/week ip starting at 8 weeks of age) was administered for 9 or 14 weeks to develop advanced liver fibrosis. In animals treated with DEN as neonates, presence of liver fibrosis led to more than doubling (to 100%) of the liver tumor incidence as early as 5 months of age. This effect was associated with activation of cells with progenitor features in noncancerous liver tissue, including markers of replicative senescence (p16), oncofetal transformation (Afp, H19, and Bex1), and increased "stemness" (Prom1 and Epcam). In contrast, the dose of DEN used did not modify the extent of liver inflammation, fibrogenesis, oxidative stress, proliferation, or apoptosis induced by subchronic CCl(4) administration. This study demonstrates the potential role of liver stem-like cells in the mechanisms of chemical-induced, fibrosis-promoted HCC. We posit that the combination of genotoxic and fibrogenic insults is a sensible approach to model liver carcinogenesis in experimental animals. These results may contribute to identification of cirrhotic patients predisposed to HCC by analyzing the expression of hepatic progenitor cell markers in the noncancerous liver tissue.


Figures

Fig. 1.
Fig. 1.
Experimental design, gross liver pathology, incidence of liver tumors, liver cell proliferation, and apoptosis. (A) Study design consisted of four groups (see Materials and Methods section) and two time points (17 and 22 weeks of age). (B) Representative photographs of the livers from the animals in each group at 22 weeks of age. (C) Incidence of the neoplastic (adenomas and carcinomas) and preneoplastic (foci) liver lesions. Mean ± SD values for percent BrDU- (D) or TUNEL- (E) positive nuclei for five randomly selected fields (devoid of foci, adenomas, or carcinomas) at ×200 are shown (n = 4–8 animals/group). Asterisks denote statistical significance from other groups (as indicated by the lines and brackets) at p < 0.05.
Fig. 2.
Fig. 2.
Liver fibrogenesis markers. (A) Representative Mason’s trichrome stain sections (×100) from animals at 22 weeks of age. (B) Immunostaining of αSMA in liver in five randomly selected fields at ×200; liver expression of Timp1 (relative to levels in PBS group at each time point). Treatment groups are denoted as indicated in the graphical legend. Mean ± SD values are shown, n = 4–8 animals/group. (C) Liver expression of profibrogenic inflammatory cytokines. Treatment groups are denoted as indicated in the legend in panel B. Mean ± SD values are shown, n = 5 animals per group. Asterisks denote statistical significance from other groups (as indicated by the lines and brackets) at p < 0.05.
Fig. 3.
Fig. 3.
Macrophage subpopulations in liver tissue and fibrotic areas. Immunohistochemical analysis of macrophage markers F4/80, CD68, CD11b, and MHC2 was conducted at 22 weeks of age. Image analysis is presented for nonfibrotic/noncancerous liver tissue (A) or fibrotic and perivascular regions (B). Mean ± SD values are shown, n = 3 animals/group. Asterisks denote statistical significance from other groups (as indicated by the lines and brackets) at p < 0.05. Panel C shows representative microphotographs at ×100.
Fig. 4.
Fig. 4.
Markers of oncofetal transformation, senescence, and cancer stem cells. Liver gene expression of the genes indicated on the y-axis of each graph was evaluated as detailed in Materials and Methods section (see Supplementary table 1 for gene names and primers). Treatment groups are denoted as indicated in the legend in top left panel. Mean ± SD values are shown, n = 5 animals/group. Asterisks denote statistical significance from other groups (as indicated by the lines and brackets) at p < 0.05.

Similar articles

Cited by

References

    1. Alkofer B., Lepennec V., Chiche L. (2011). Hepatocellular cancer in the non-cirrhotic liver. J. Visc. Surg. 148, 3–11 - PubMed
    1. Aoyama T., Inokuchi S., Brenner D. A., Seki E. (2010). CX3CL1-CX3CR1 interaction prevents carbon tetrachloride-induced liver inflammation and fibrosis in mice. Hepatology. 52, 1390–1400 - PMC - PubMed
    1. Becker F. F. (1983). Thioacetamide hepatocarcinogenesis. J. Natl. Cancer Inst. 71, 553–558 - PubMed
    1. Braeuning A., Jaworski M., Schwarz M., Köhle C. (2006). Rex3 (reduced in expression 3) as a new tumor marker in mouse hepatocarcinogenesis. Toxicology. 227, 127–135 - PubMed
    1. Bucher J. R. (1998). Update on national toxicology program (NTP) assays with genetically altered or “transgenic” mice. Environ. Health Perspect. 106, 619–621 - PMC - PubMed

Publication types