. 2013 Mar 1;73(5):1524-35.
doi: 10.1158/0008-5472.CAN-12-2796. Epub 2013 Jan 3.

Acidity generated by the tumor microenvironment drives local invasion

Affiliations

Acidity generated by the tumor microenvironment drives local invasion

Veronica Estrella et al. Cancer Res. .

Abstract

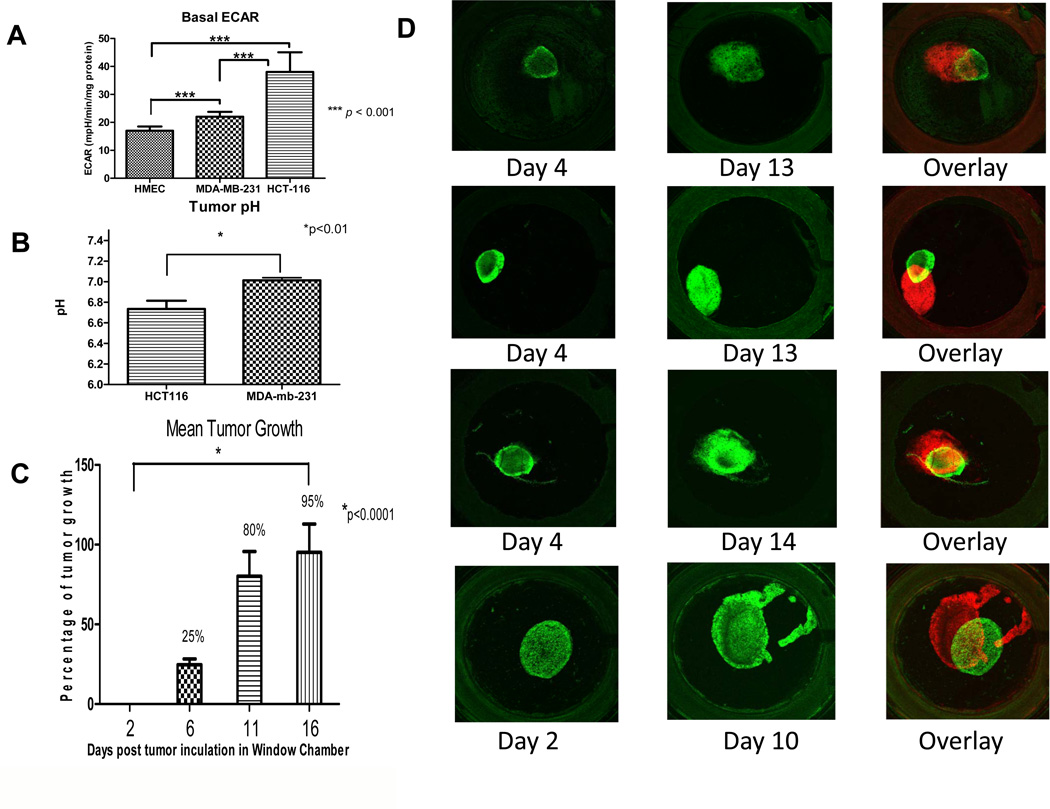
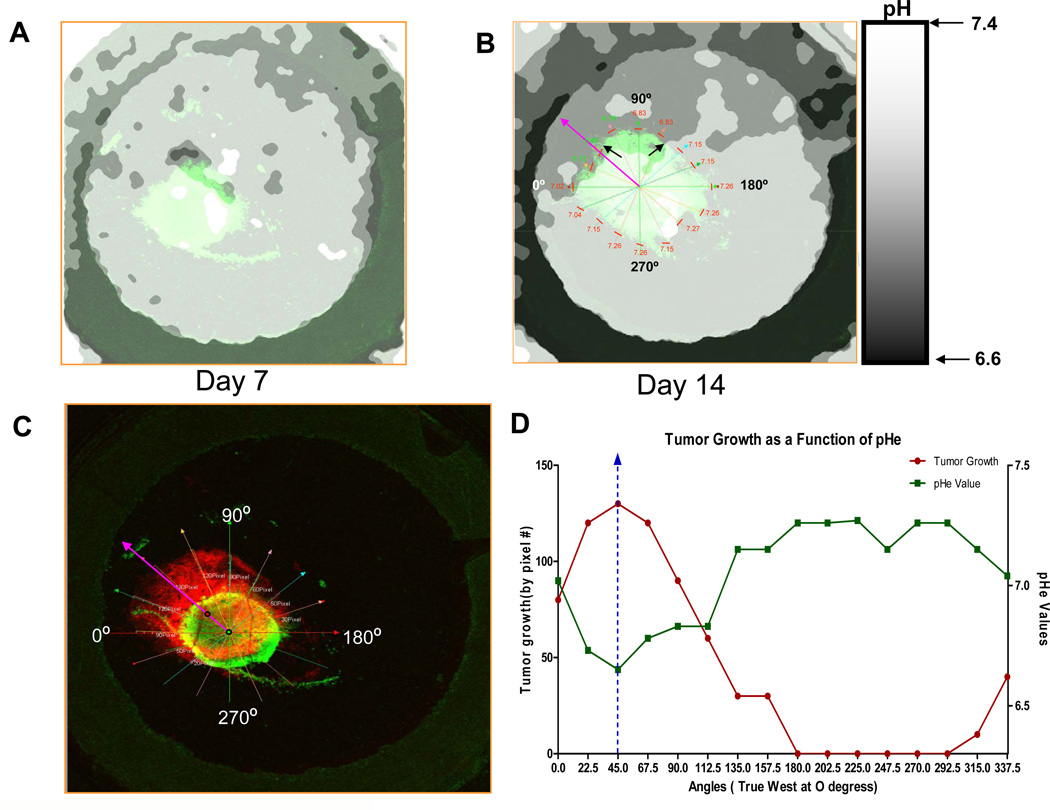
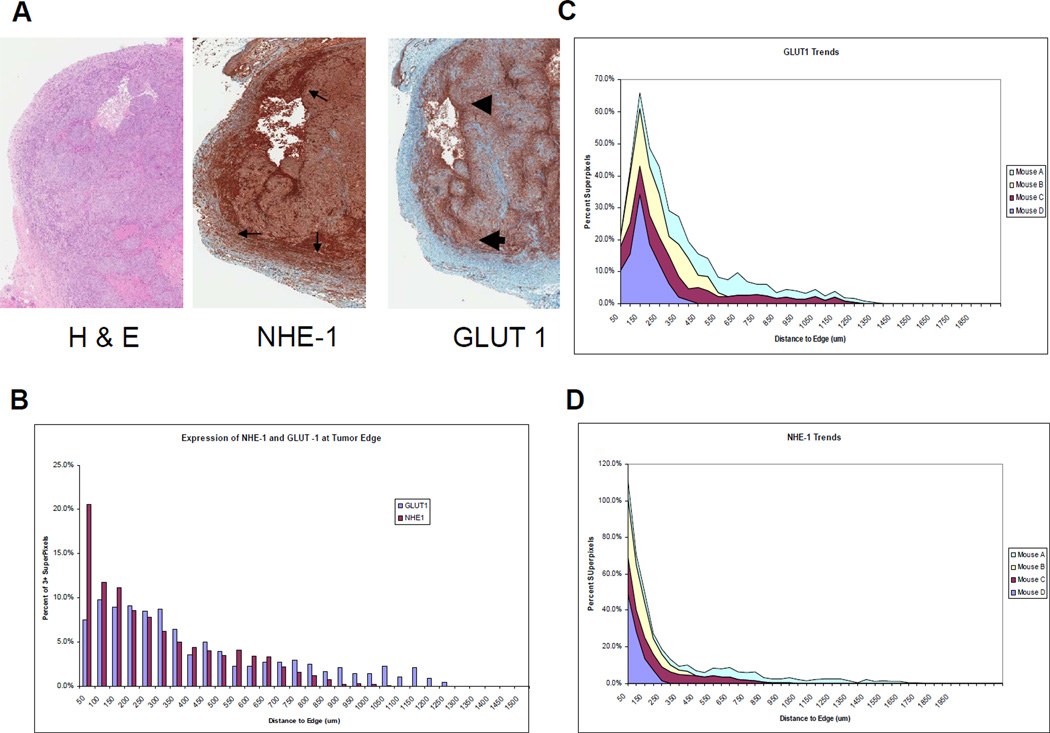
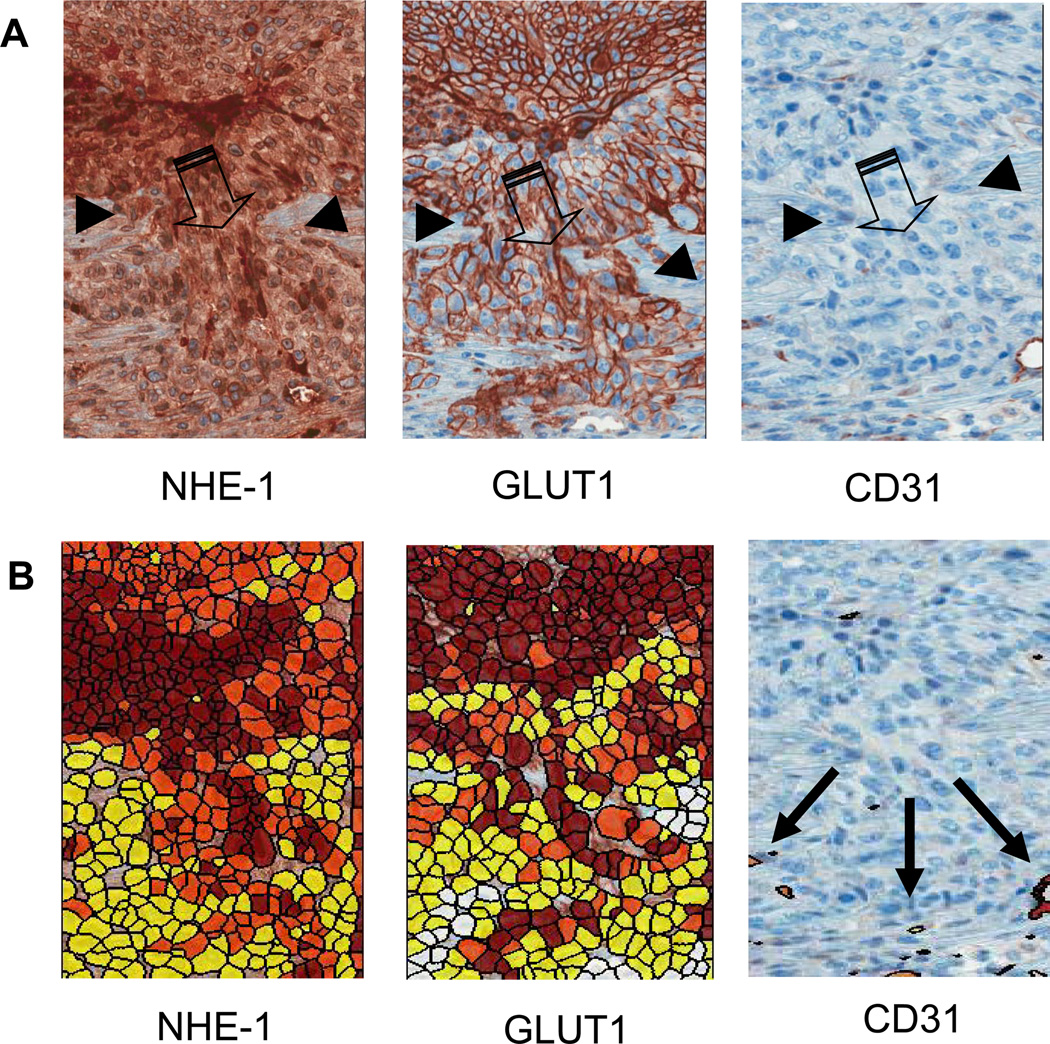
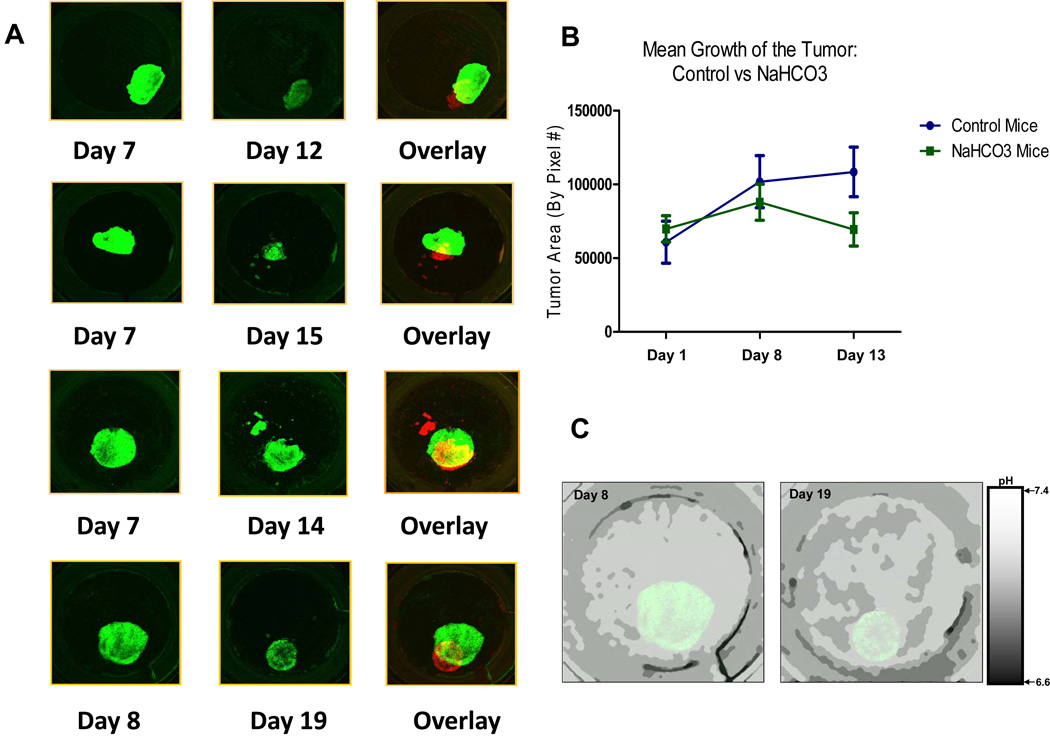
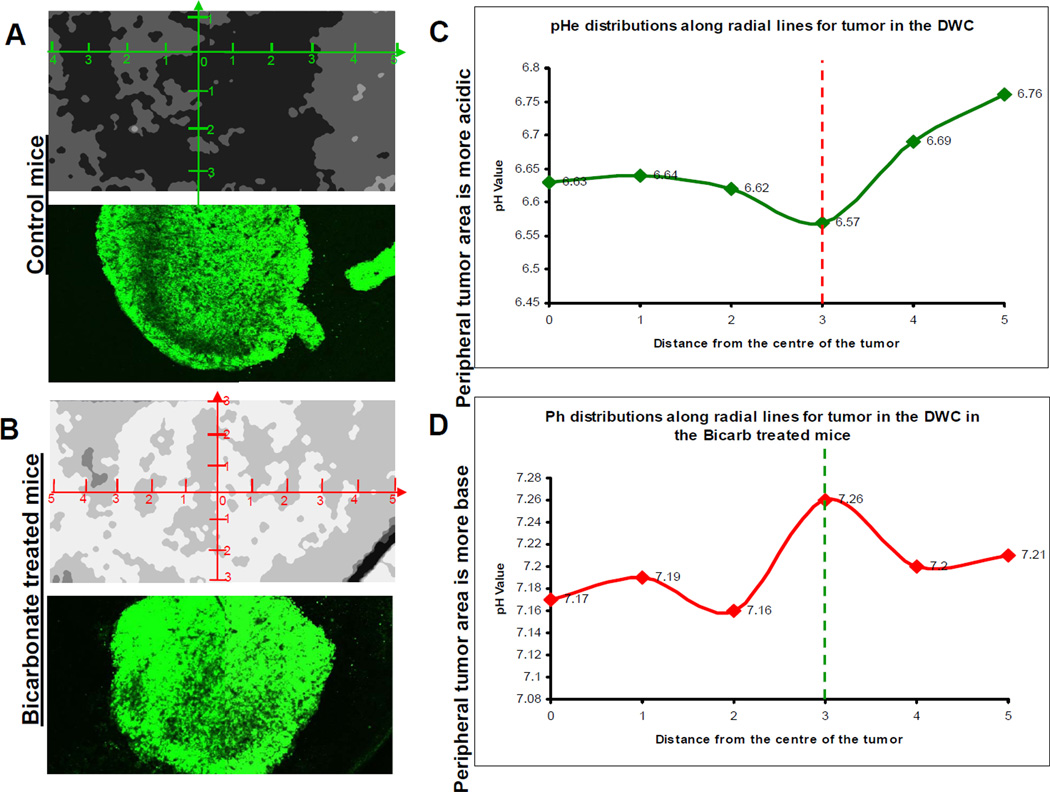
The pH of solid tumors is acidic due to increased fermentative metabolism and poor perfusion. It has been hypothesized that acid pH promotes local invasive growth and metastasis. The hypothesis that acid mediates invasion proposes that H(+) diffuses from the proximal tumor microenvironment into adjacent normal tissues where it causes tissue remodeling that permits local invasion. In the current work, tumor invasion and peritumoral pH were monitored over time using intravital microscopy. In every case, the peritumoral pH was acidic and heterogeneous and the regions of highest tumor invasion corresponded to areas of lowest pH. Tumor invasion did not occur into regions with normal or near-normal extracellular pH. Immunohistochemical analyses revealed that cells in the invasive edges expressed the glucose transporter-1 and the sodium-hydrogen exchanger-1, both of which were associated with peritumoral acidosis. In support of the functional importance of our findings, oral administration of sodium bicarbonate was sufficient to increase peritumoral pH and inhibit tumor growth and local invasion in a preclinical model, supporting the acid-mediated invasion hypothesis. Cancer Res; 73(5); 1524-35. ©2012 AACR.


Conflict of interest statement

No relevant Conflicts of Interest

Figures

Figure 1
Figure 1. Proton production, pHe and tumor growth
(A) In vitro extracellular acidification rate, ECAR, of tumor cells vs. normal cells. The rate of proton production was determined over a 30 minute time period using Seahorse XF-96 Instrument designed to measure in vitro metabolic rates. We show a significant increase in H+ production especially in our colon cancer cell line HCT116 when compared to human normal mammary epithelial cells HMEC (*P<0.001). (B) In vivo pH tumor measurements. Tumor pH measurements were obtained by electrode. The average pH of the tumors for each cell line are shown, with a significantly (*P<0.01) lower pHe in the HCT116, compared to MDA-mb-231, tumors. (C) Mean growth of HCT116/GFP tumors within the dorsal window chamber. Tumor area was measured at days 2, 6, 11 and 16 by fluorescent pixel number. Data are expressed as percent increase by the ratio of area at given day to that of day 2 and subtracting 100 for normalization. Thus, a 100 percent increase represents a doubling of area. The mean growth illustrated a significant increase in size of the tumor over 2 weeks (p<0.0001). (D) Intravital microscopy images of in vivo tumor growth in the dorsal window chamber. The images were captured with a 1.25X lens on days 2 or 4 and 10, 13 or 14. These longitudinal images were pseudo-colored green (early) or red (late) in order to superimpose the images and observe magnitude and direction of tumor growth.
Figure 2
Figure 2. Intravital and ratiometric images of the extracellular pH with SNARF-1
Data are shown for one tumor, which was representative of four control tumors. The extracellular pH (pHe) of HCT116-GFP tumors were measured using SNARF-1 Free Acid at (A) day 7 and (B) day 14. 200µl of 1mmol/L of SNARF solution was injected into the mice via tail vein injection. Images were captured using a 1.25X lens, 50 minutes post SNARF-1 injection. The pHe was measured and ratiometric images were converted to a pH image using calibration data as per Material and Methods. Black arrows are indicating the acidic environment towards which the tumor is growing. In figure (B), the day 14 ratiometric image was co-registered with its corresponding fluorescence image. The pHe was then measured 100microns from the tumor edge (represented by the short red lines). pHe measurements were taken every 22.5 degrees of arc and are located above red lines. Purple arrow indicates the region of strongest acidity and direction of tumor growth. (C) Tumor at day 14 was pseudo-colored red in order to superimpose the tumor image on Day 4 (green) and measure tumor growth from tumor edge on Day 4 to tumor edge on Day 14. Radial lines designate angles and tumor growth was measured by pixels. (D) Tumor growth and pHe plotted as a function of angle.
Figure 3
Figure 3. Histology of HCT116/GFP tumors
(A) The tumor edge has an increased expression of NHE-1 (small thin arrows) and GLUT1 (large arrows), which is indicative of acidification caused by an increase in glycolysis. This is consistent with microenvironmental acidosis observed in vivo leading to subsequent invasion. (B) Expression of GLUT-1 and NHE-1 as a function of distance from the tumor edge. (C) and (D) Expression trends of GLUT-1 and NHE-1 as a function of distance from tumor edge in N=4 tumors.
Figure 4
Figure 4. Histology of the invasive edge
(A) Upregulation of NHE-1 exchangers and GLUT-1 are demonstrated by a darker staining of the tumor cells at the invasive front, consistent with an increase in glycolysis and acidosis. CD31 staining is low, suggesting poor perfusion and hence a potential for hypoxia. Images illustrate a region of the tumor edge (small thin arrows) invading into the peritumoral normal tissue (large arrows). (B) Expression of tumor markers GLUT-1, NHE-1, and CD31 were quantified on a per-cell basis (see Methods). Red indicates strong staining, orange is moderate and yellow is weak.
Figure 5
Figure 5. Effects of NaHCO3
(A) Images were captured with a 1.25X lens, showing how we tracked the growth of HCT116-GFP tumors that were treated with 200mmol/L of NaHCO3. Tumor at day 12, 14, 15 and 19 were pseudo-colored red in order to superimpose the images and demonstrate a decrease in tumor size. Images were captured using the Olympus FV1000 MPE laser scanning microscope. (B) Mean area of bicarbonate-treated and control tumors (in pixel count) on days 1, 8 and 13. (C) pHe images of bicarbonate-treated tumors on days 8 and 19. Mice were treated with NaHCO3 as per Materials and Methods. The pHe of HCT116-GFP tumors were measured using SNARF-1 free Acid at day 8 and day 19. 200µl of 1mmol/L of SNARF solution was injected into the mice via tail vein injection. Confocal images were captured 50 minutes post SNARF-1 injection. The pHe was measured and ratiometric images were converted to a pH image using calibration data as per Material and Methods
Figure 6
Figure 6. The effect of NaHCO3 treatment on tumor pH
A and B) Ratiometric images from SNARF-1 analysis were used to measure and compare the pH of control tumors to those tumors that were treated with 200mmol/L of NaHCO3. In vitro pH calibration was applied to the ratiometric image. pHe profiles, that originated from the center of the tumor, were obtained using a radial graph. pHe values were obtained along the radial lines and the margins of the tumors were defined using GFP images of the tumor. C and D) Least-square fit across all directions and all tumors showing pHe distributions along radial lines. “0” is centroid of tumor in this image. The vertical line indicates tumor edge. Peripheral tumor area is more acidic.

References

    1. Ruoslahti E. How cancer spreads. Sci Am. 1996;275(3):72–77. - PubMed
    1. Friedl P, Wolf K. Tumour-cell invasion and migration: diversity and escape mechanisms. Nature reviews Cancer. 2003;3(5):362–374. - PubMed
    1. Schornack PA, Gillies RJ. Contributions of cell metabolism and H+ diffusion to the acidic pH of tumors. Neoplasia. 2003;5(2):135–145. - PMC - PubMed
    1. Stubbs M, McSheehy PM, Griffiths JR, Bashford CL. Causes and consequences of tumour acidity and implications for treatment. Mol Med Today. 2000;6(1):15–19. - PubMed
    1. Gillies RJ, Liu Z, Bhujwalla Z. 31P-MRS measurements of extracellular pH of tumors using 3-aminopropylphosphonate. The American journal of physiology. 1994;267(1 Pt 1):C195–C203. - PubMed

Publication types