. 2013 Jan 1;36(1):59-72.
doi: 10.5665/sleep.2302.

Local experience-dependent changes in the wake EEG after prolonged wakefulness

Affiliations

Local experience-dependent changes in the wake EEG after prolonged wakefulness

Ching-Sui Hung et al. Sleep. .

Abstract

Study objectives: Prolonged wakefulness leads to a progressive increase in sleep pressure, reflected in a global increase in slow wave activity (SWA, 0.5-4.5 Hz) in the sleep electroencephalogram (EEG). A global increase in wake theta activity (5-9 Hz) also occurs. Recently, it was shown that prolonged wakefulness in rodents leads to signs of "local sleep" in an otherwise awake brain, accompanied by a slow/theta wave (2-6 Hz) in the local EEG that occurs at different times in different cortical areas. Compelling evidence in animals and humans also indicates that sleep is locally regulated by the amount of experience-dependent plasticity. Here, we asked whether the extended practice of tasks that involve specific brain circuits results in increased occurrence of local intermittent theta waves in the human EEG, above and beyond the global EEG changes previously described.

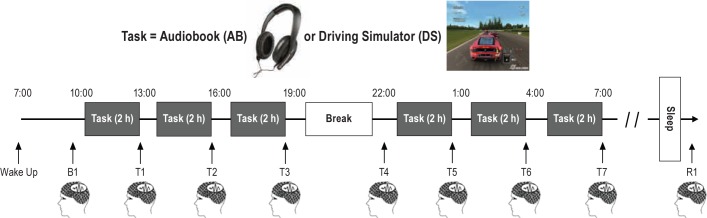
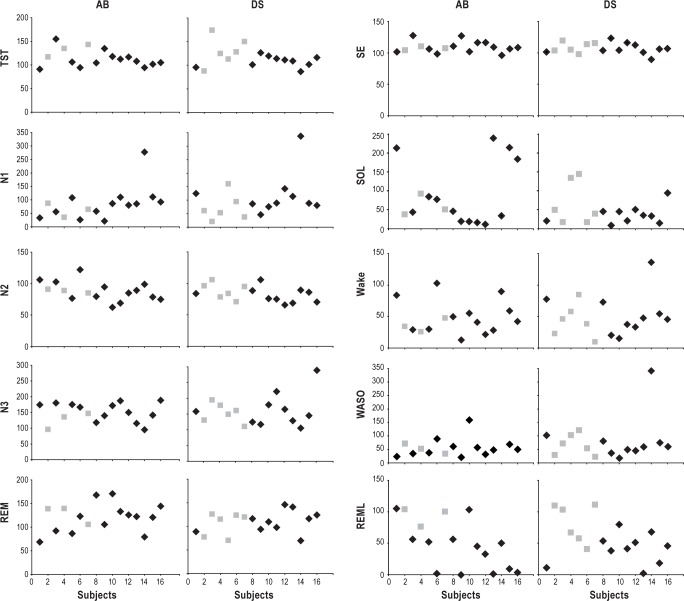
Design: Participants recorded with high-density EEG completed 2 experiments during which they stayed awake ≥ 24 h practicing a language task (audiobook listening [AB]) or a visuomotor task (driving simulator [DS]).

Setting: Sleep laboratory.

Patients or participants: 16 healthy participants (7 females).

Interventions: Two extended wake periods.

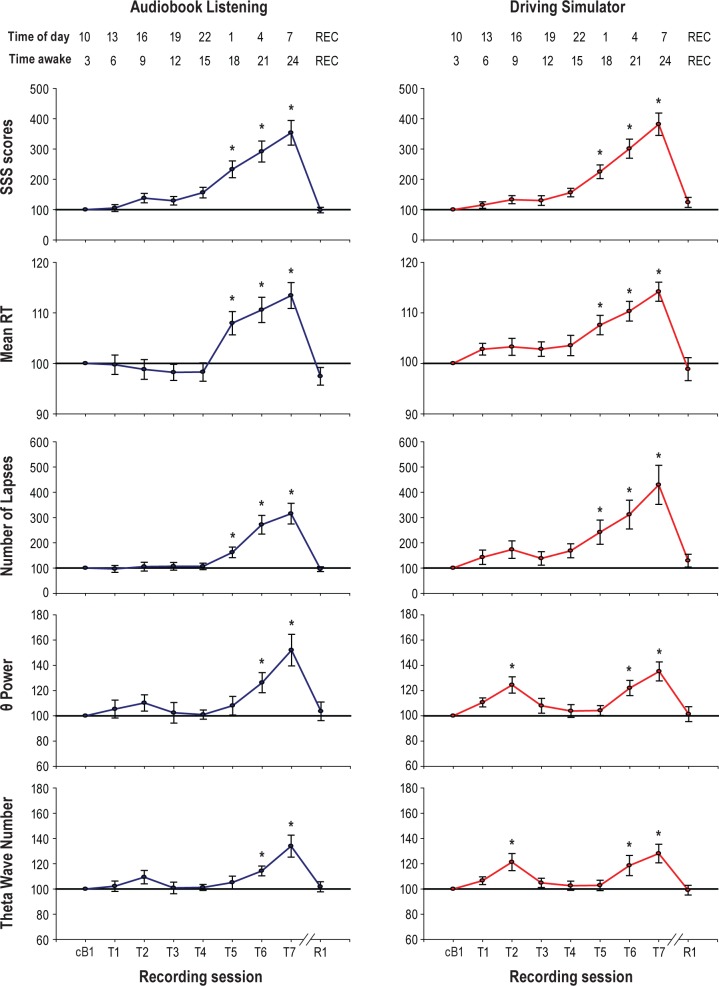
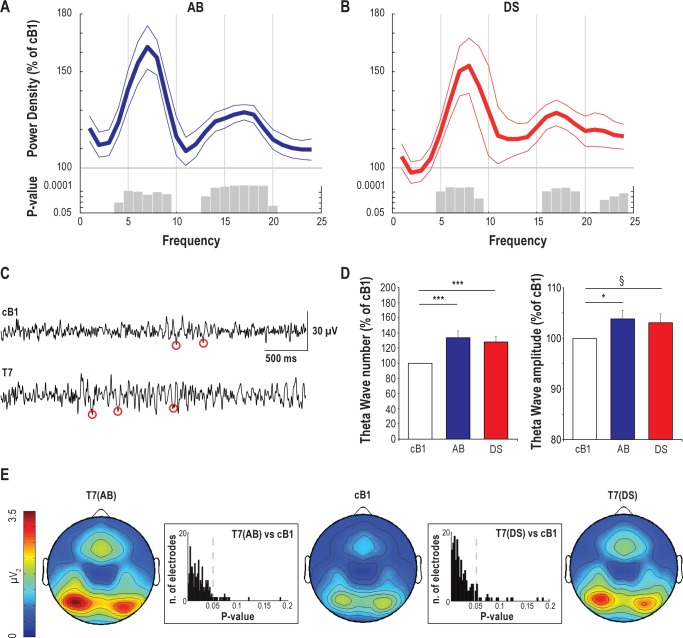
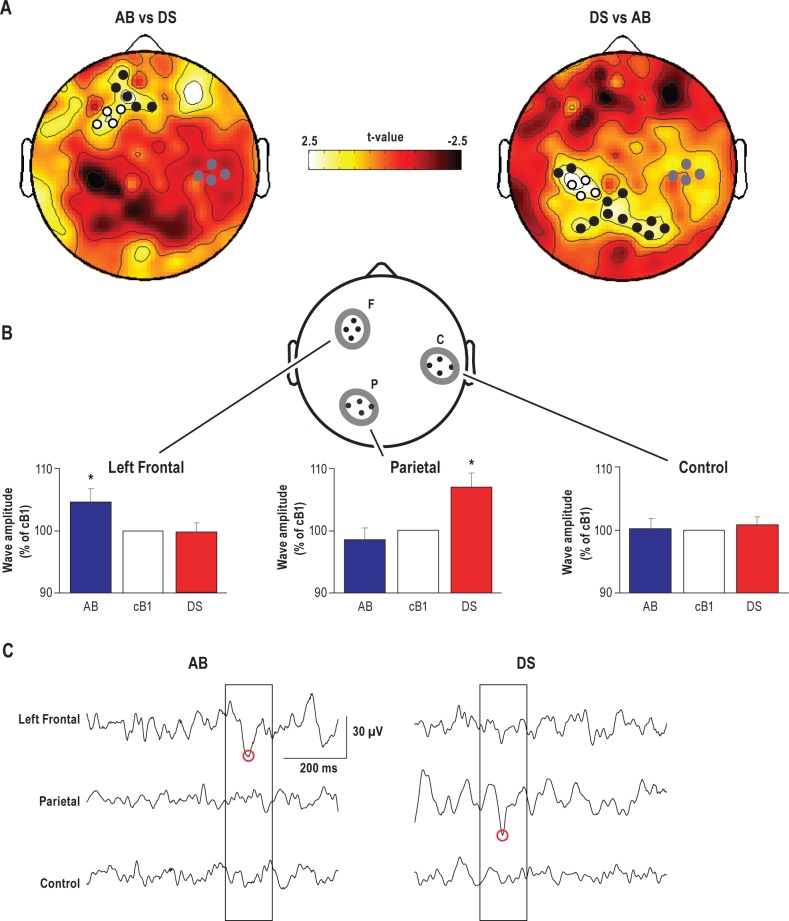
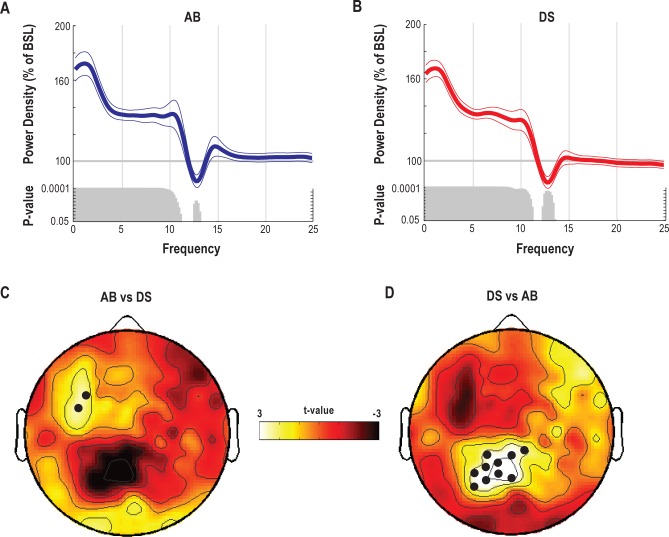
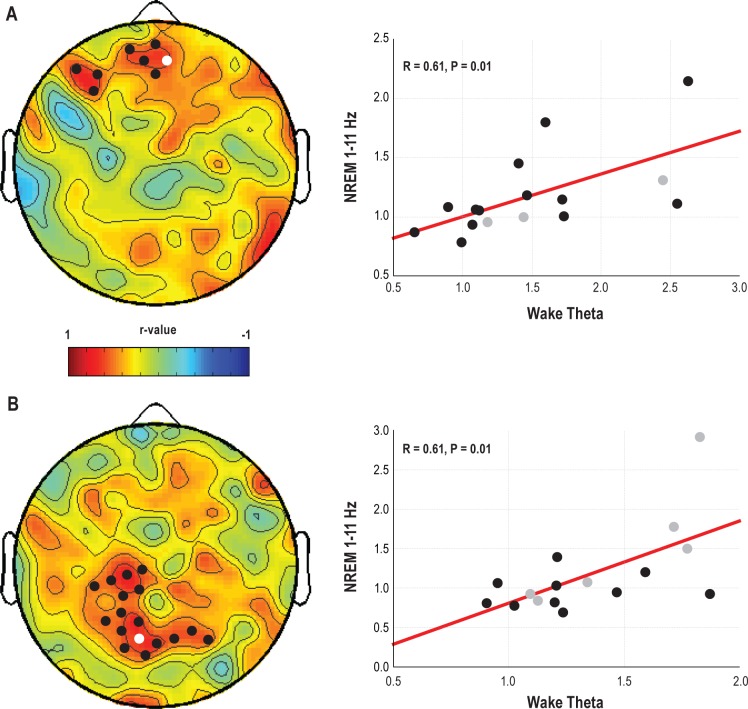
Measurements and results: Both conditions resulted in global increases in resting wake EEG theta power at the end of 24 h of wake, accompanied by increased sleepiness. Moreover, wake theta power as well as the occurrence and amplitude of theta waves showed regional, task-dependent changes, increasing more over left frontal derivations in AB, and over posterior parietal regions in DS. These local changes in wake theta power correlated with similar local changes in sleep low frequencies including SWA.

Conclusions: Extended experience-dependent plasticity of specific circuits results in a local increase of the wake theta EEG power in those regions, followed by more intense sleep, as reflected by SWA, over the same areas.


Figures

Figure 1
Figure 1
Experimental design. In each experiment participants woke up at ∼07:00 and underwent a baseline testing session (B1) at 10:00, followed by six 2-h tasks (AB or DS) interleaved by 1-h EEG recording sessions (T1–T7, total wake time: 24 h). A final testing session (R1) was scheduled 30 min after participants woke up from ∼ 8 h of recovery sleep. In most experiments participants remained awake for 24 h and were allowed to sleep in the morning (starting at ∼ 08:30). In 9 experiments, participants were awake for 36 h, and went to sleep in the evening (see Methods for details).
Figure 2
Figure 2
Changes in vigilance and EEG theta power during prolonged wake. From top to bottom, subjective sleepiness (Stanford Sleepiness Scale, SSS scores), PVT mean reaction time (RT), number of PVT lapses, wake EEG power in the theta range and number of theta waves (average of 185 EEG derivations). Since exploratory analyses demonstrated that baseline values for AB and DS were similar (paired t-test; t = 0.44, P = 0.6), they were combined to calculate a new “common” average baseline (cB1). Each trace depicts mean ± SEM (n = 16) of each session expressed relative to cB1 (= 100). One-way repeated measure ANOVA with factor “Session.” SSS scores: F8,120 = 162.72, P < 0.00001 (AB); F8,120 = 70.94, P < 0.00001 (DS). Mean RT: F8,120 = 33.62, P < 0.00001 (AB); F8,120 = 15.29, P < 0.00001 (DS). Number of Lapses: F8,120 = 36.82, P < 0.00001 (AB), F8,120 = 24.28, P < 0.00001 (DS). Theta power: F8,120 = 5.71, P < 0.00001 (AB); F8,120 = 6.93, P < 0.00001 (DS). Wave number: F8,120 = 8.12, P < 0.00001 (AB and DS). Post hoc 2-tailed paired t-tests compared each testing session with cB1. Asterisks show significant change from cB1 (P < 0.005, Bonferroni corrected). REC: time after recovery sleep.
Figure 3
Figure 3
Global effects of prolonged wake on EEG power spectra, theta power distribution, and occurrence of theta waves. (A,B) Relative EEG power spectra during T7 relative to baseline (average of 185 channels, mean ± SEM, n = 16). Since exploratory analyses demonstrated that baseline values for AB and DS were similar (paired t-test; t = 0.44, P = 0.6), they were combined to calculate a new “common” average baseline (cB1). Gray bars indicate significant bins (paired t-test; P < 0.05). (C) Representative EEG records from one subject depicting 4-s of EEG raw signal during cB1 and T7 (channel F3). Red circles indicate the negative peaks of theta waves detected in each EEG trace. (D) Changes in number and negative peak amplitude of theta waves between cB1 (100%) and T7 for the 2 experiments (average of 185 channels, mean ± SEM, n = 16). ***P < 0.005; *P < 0.05; §P = 0.08. (E) Topographic distribution of absolute theta power (average spectral density in the theta range) after 24 h of wake (T7) for both experiments and during cB1. Values (mean of 16 participants) were plotted at the corresponding position on the planar projection of the scalp surface and interpolated (biharmonic spline) between electrodes. Boxes represent the P-value distribution for the theta power topographic statistical comparison at T7 vs. cB1 for AB (left) and DS (right).
Figure 4
Figure 4
Local task-dependent effects of prolonged wake on EEG theta power and theta wave occurrence. (A) Topographic distribution of t-values from paired t-tests contrasting relative power changes from cB1 to T6 session between AB and DS in the theta frequency band (5-9 Hz). Here, negative t-values indicate changes in the opposite direction. Black and white dots show channels with significant increase in spectral power (P < 0.05, SnPM using a supra-threshold cluster analysis). White dots show channels included in the left frontal and parietal regions, while gray dots show channels included in the control region for the theta wave amplitude analysis. (B) Theta wave negative peak amplitude (mean ± SEM, n = 16) in the task-related regions (F: left frontal; P: parietal) and a control region (C) during T6 relative to cB1. One-way ANOVA with repeated-measure in each cluster demonstrated significant condition effect in the task-related clusters F (F2,30 = 3.67, P = 0.03) and P (F2,30 = 3.84, P = 0.03), but not in the control cluster C (F2,30 = 0.03, P = 0.97). Post hoc Student-Newman-Keuls Range tests analyzing the difference between conditions revealed that AB led to a significant increase over the F cluster and DS induced a similar increase over the P cluster (* significantly different from each of the other 2 conditions). Values for each ROI were averaged across the 4 electrodes. Note that the electrodes depicted in panel B are simply a schematic representation of the three ROIs. The exact location of the included electrodes is shown in panel A, white and gray dots. (C) Representative examples of local theta waves (boxed). Red circles indicate the negative peaks of theta waves detected in each EEG trace.
Figure 5
Figure 5
Sleep parameters during recovery sleep for each of the 16 participants. TST, total sleep time; N1-3, NREM stages 1, 2, 3; REM, REM sleep; SE, sleep efficiency; SOL, sleep onset latency; WASO, wake after sleep onset; REML, latency to first REM sleep episode. All values are % relative to BSL (= 100). In gray are displayed the participants whose recovery sleep was recorded at night, after 36 h of wake. AB, audiobook listening; DS, driving simulator.
Figure 6
Figure 6
Effects of prolonged wake on NREM EEG power spectra during recovery sleep. (A,B) Relative EEG power spectra for the AB and DS experiments averaged across 185 channels (mean ± SEM, n = 16) during NREM recovery sleep relative to BSL. Gray bars indicate significant bins (2-tailed paired t-test; P < 0.05). (C,D) Topographic distribution of t-values from paired t-tests contrasting relative power changes between the AB and DS recovery nights in the 1-11 Hz frequency band. Negative values indicate changes in the opposite direction. Channels showing significant increase in spectral power in AB relative to DS are indicated by black dots (P < 0.05 SnPM supra-threshold cluster analysis; note that in C the cluster size does not exceed the minimum threshold cluster size for significance (i.e., n = 2). Thus, the dots for C correspond to P < 0.05, uncorrected).
Figure 7
Figure 7
Correlation between changes in theta power during prolonged wake and changes in low frequencies during recovery sleep as compared to baseline sleep. Left panels, topographic distribution of r-values from Pearson correlation between changes in wake theta power (T7 relative to cB1) and changes in whole night NREM 1-11Hz power (recovery sleep relative to BSL) for the AB (A) and DS (B) experiments. Black dots represent derivations with significant correlations (P < 0.05). Right panels, scatterplots for a representative channel included in the AB and DS significant clusters (colored in white in the topographies). In gray those participants whose recovery sleep was recorded at night, after 36 h of wake.

Similar articles

Cited by

References

    1. Vyazovskiy VV, Cirelli C, Pfister-Genskow M, Faraguna U, Tononi G. Molecular and electrophysiological evidence for net synaptic potentiation in wake and depression in sleep. Nat Neurosci. 2008;11:200–8. - PubMed
    1. Gilestro GF, Tononi G, Cirelli C. Widespread changes in synaptic markers as a function of sleep and wakefulness in Drosophila. Science. 2009;324:109–12. - PMC - PubMed
    1. Liu ZW, Faraguna U, Cirelli C, Tononi G, Gao XB. Direct evidence for wake-related increases and sleep-related decreases in synaptic strength in rodent cortex. J Neurosci. 2010;30:8671–5. - PMC - PubMed
    1. Bushey D, Tononi G, Cirelli C. Sleep and synaptic homeostasis: structural evidence in Drosophila. Science. 2011;332:1576–81. - PMC - PubMed
    1. Tononi G, Cirelli C. Sleep function and synaptic homeostasis. Sleep Med Rev. 2006;10:49–62. - PubMed

Publication types

LinkOut - more resources