. 2013 Jan 5:12:2.
doi: 10.1186/1476-4598-12-2.

Decreased expression of ADAMTS-1 in human breast tumors stimulates migration and invasion

Affiliations

Decreased expression of ADAMTS-1 in human breast tumors stimulates migration and invasion

Vanessa M Freitas et al. Mol Cancer. .

Abstract

Background: ADAMTS-1 (a disintegrin and metalloprotease with thrombospondin motifs) is a member of the ADAMTS family of metalloproteases. Here, we investigated mRNA and protein levels of ADAMTS-1 in normal and neoplastic tissues using qPCR, immunohistochemistry and immunoblot analyses, and we addressed the role of ADAMTS-1 in regulating migration, invasion and invadopodia formation in breast tumor cell lines.

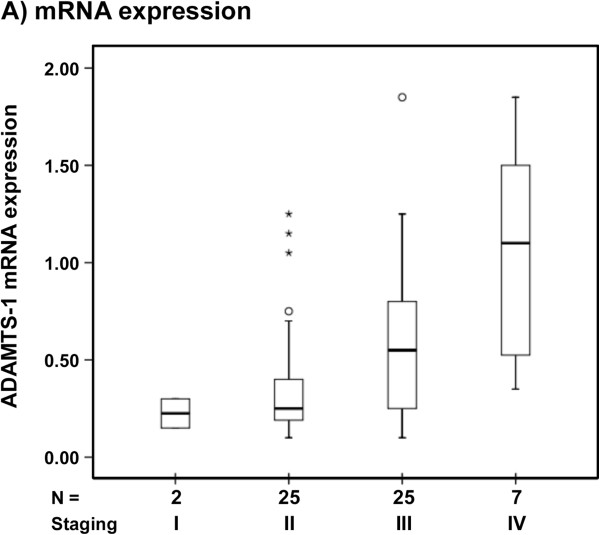
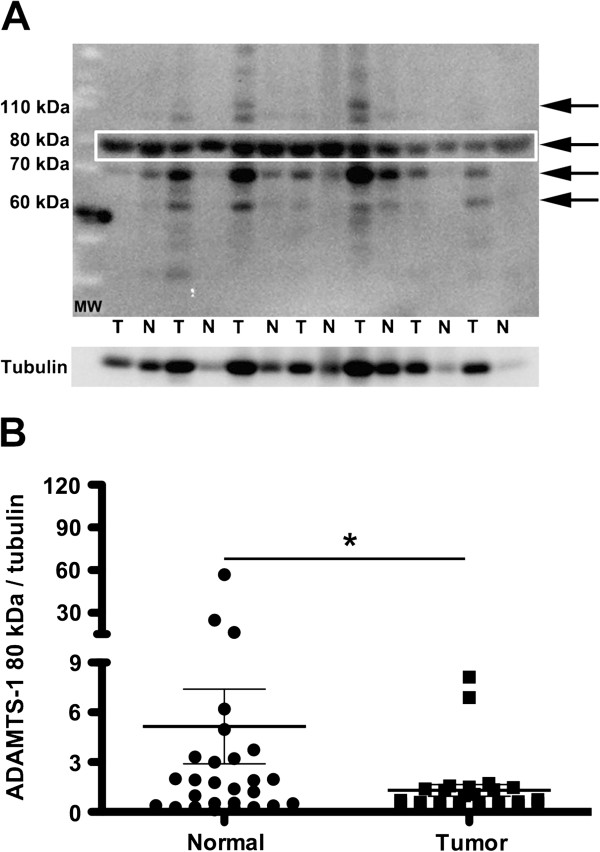
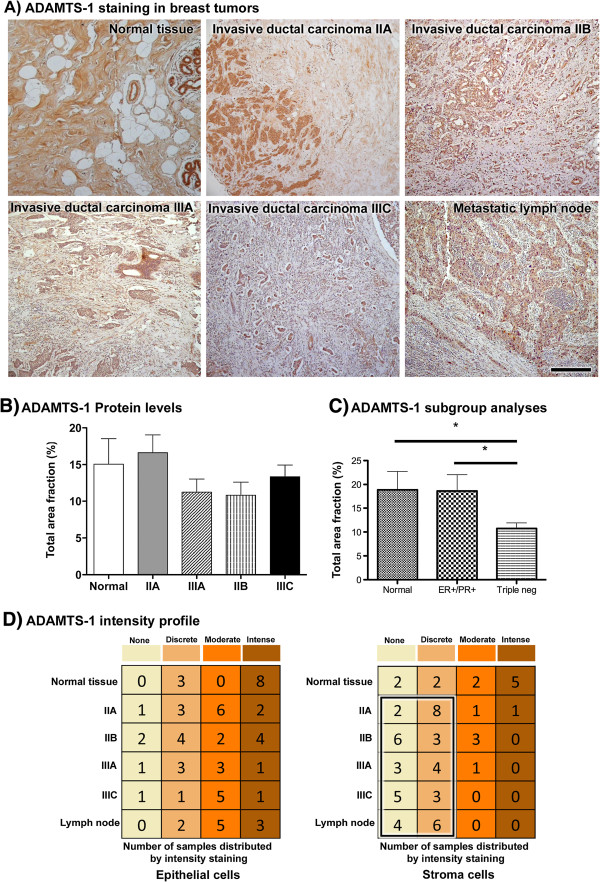
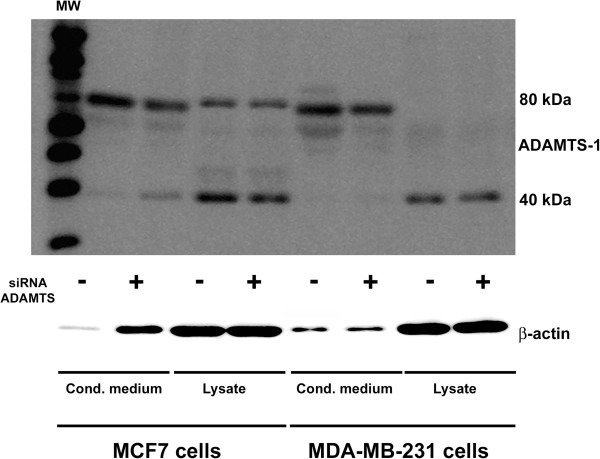
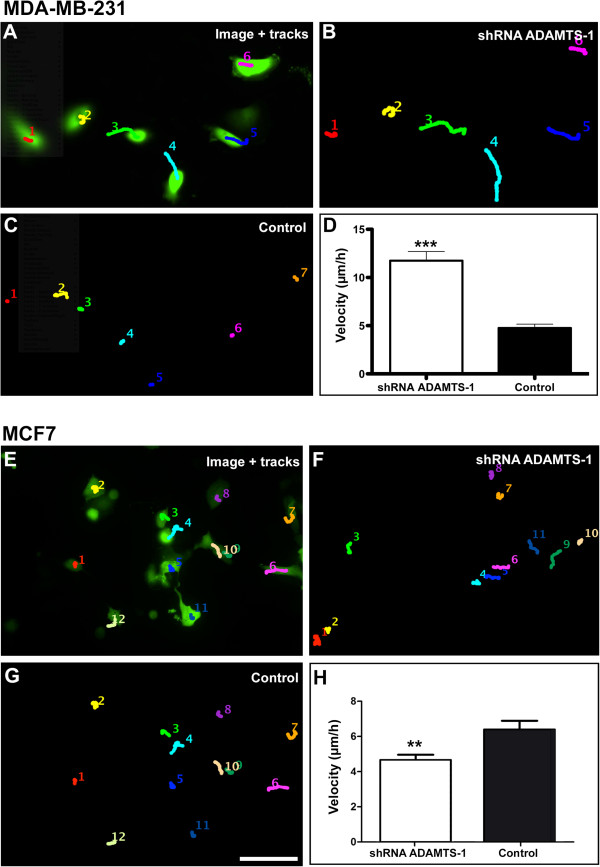
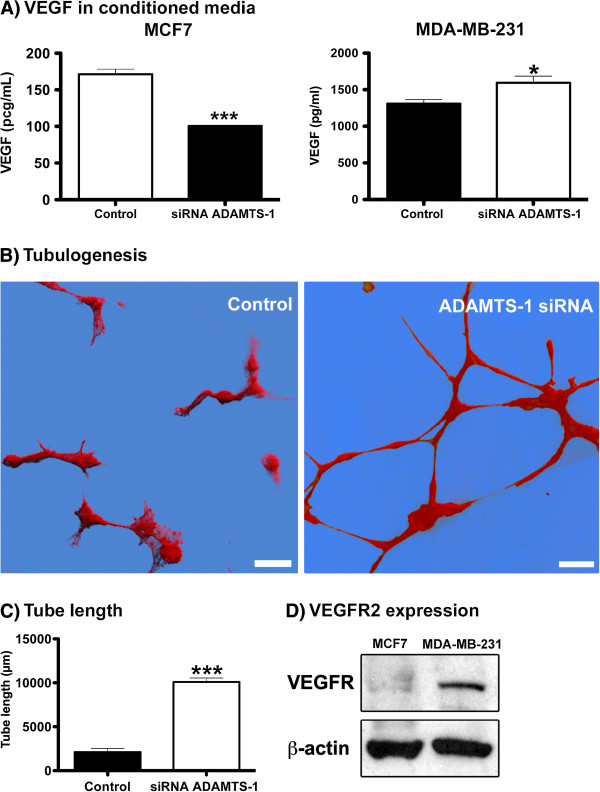
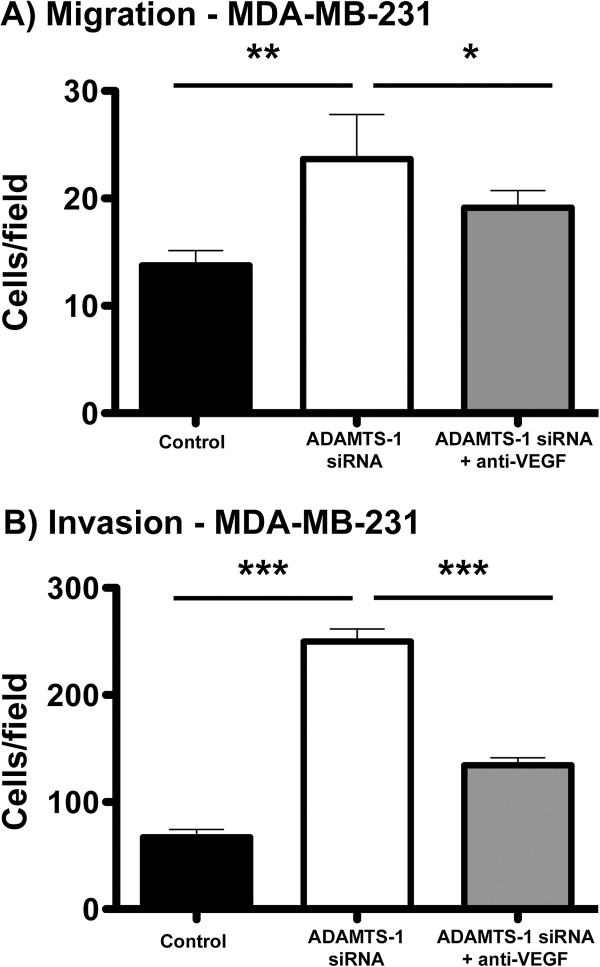
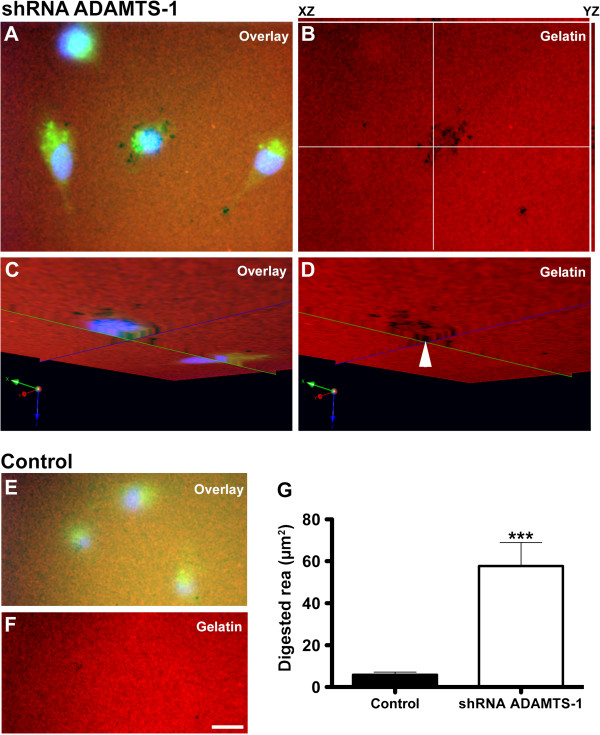
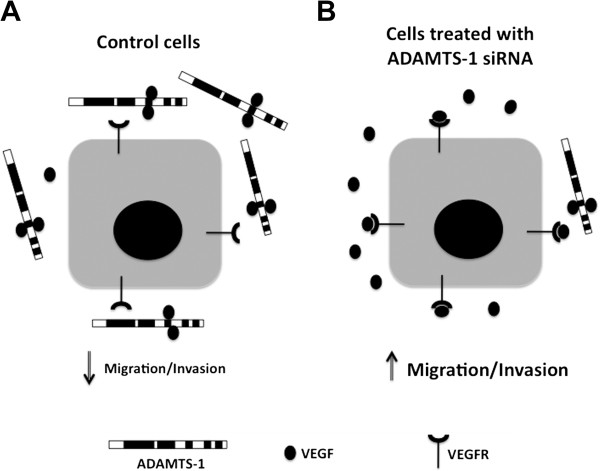
Results: In a series of primary breast tumors, we observed variable levels of ADAMTS-1 mRNA expression but lower levels of ADAMTS-1 protein expression in human breast cancers as compared to normal tissue, with a striking decrease observed in high-malignancy cases (triple-negative for estrogen, progesterone and Her-2). This result prompted us to analyze the effect of ADAMTS-1 knockdown in breast cancer cells in vitro. MDA-MB-231 cells with depleted ADAMTS-1 expression demonstrated increased migration, invasion and invadopodia formation. The regulatory mechanisms underlying the effects of ADAMTS-1 may be related to VEGF, a growth factor involved in migration and invasion. MDA-MB-231 cells with depleted ADAMTS-1 showed increased VEGF concentrations in conditioned medium capable of inducing human endothelial cells (HUVEC) tubulogenesis. Furthermore, expression of the VEGF receptor (VEGFR2) was increased in MDA-MB-231 cells as compared to MCF7 cells. To further determine the relationship between ADAMTS-1 and VEGF regulating breast cancer cells, MDA-MB-231 cells with reduced expression of ADAMTS-1 were pretreated with a function-blocking antibody against VEGF and then tested in migration and invasion assays; both were partially rescued to control levels.

Conclusions: ADAMTS-1 expression was decreased in human breast tumors, and ADAMTS-1 knockdown stimulated migration, invasion and invadopodia formation in breast cancer cells in vitro. Therefore, this series of experiments suggests that VEGF is involved in the effects mediated by ADAMTS-1 in breast cancer cells.


Figures

Figure 1
Figure 1
The relative mRNA expression of ADAMTS-1 in primary breast tumors according to clinical stage (TNM). The box plot shows data distributed in relation to the median values for ADAMTS-1 mRNA expression in 60 primary breast tumors stratified by clinical stage (p = 0.002). Three stage III cases with ADAMTS-1 expression above 2.0 (2.75, 4.95, 7.3) were excluded from the graphic for better visualization.
Figure 2
Figure 2
Immunoblot of ADAMTS-1 in tumor (T) and adjacent normal tissue (N). Four bands were identified as ADAMTS-1 (A, arrows). Ductal carcinomas and matched adjacent tissues were obtained from twenty-eight patient donors and analyzed. The 80 kDa band/tubulin ratio was significantly lower in tumors as compared to normal tissues (B). No differences were found among other bands obtained from neoplastic and normal tissues (not illustrated). The boxed area shows the 80 kDa bands that were evaluated by densitometry. The asterisks indicate significant data (p < 0.05).
Figure 3
Figure 3
ADAMTS-1 was more abundant in normal tissue stroma as compared to tumor stroma. ADAMTS-1 staining is shown for normal tissue, invasive ductal carcinoma of grades IIA, IIB, IIIA and IIIC and metastatic lymph nodes (A). When the total area fraction was analyzed by immunohistochemistry, ADAMTS-1 showed no statistically significant difference in staining between normal and tumor tissues (B). However, a decreasing trend was observed in high-grade types (IIIA and IIB). Subgroup analysis revealed a significant decrease in ADAMTS-1 expression in triple negative tumors as compared to normal tissues and ER- or PR-positive tumors (C). The labeling intensity profile (D) shows that the expression of ADAMTS-1 in normal tissue was prominent in both epithelial cells and stroma. In contrast, ADAMTS-1 staining was discrete or absent in tumor stroma (D, boxed area), and this discrete or absent staining pattern was more evident in higher grades of malignancy (D, boxed area). Scale bar: 50 μm.
Figure 4
Figure 4
ADAMTS-1 expression in cell lysates and conditioned medium from MCF7 and MDA-MB-231 cells. These cells showed reduced expression of ADAMTS-1 following siRNA treatment. The lysates and conditioned media were analyzed by immunoblot, and an 80-kDa band was prevalent in the conditioned medium from both cells lines, but more prominently in MDA-MB-231. A 40-kDa smaller band was predominant in the cell lysates. The immunoblot also illustrated the efficiency of ADAMTS-1 siRNA knockdown. These experiments were carried out at least six times, and similar results were consistently obtained.
Figure 5
Figure 5
ADAMTS-1 knockdown increased the velocity of MDA-MB-231 cells, as shown by time-lapse video microscopy. The cells were transfected with either ADAMTS-1 shRNA-GFP (treated) or non-silencing shRNA-GFP (controls). The fluorescent images were superimposed with the MDA-MB-231 cell trajectories (A, color tracks) and are illustrated as manual markings on the same cell at different time points. The cells were recorded after 4.5 hours. The treated cells (B) demonstrated longer trajectories over time as compared to the controls (C). The velocity of the treated cells was also higher as compared to the controls (D). The asterisks indicate significant data in comparison to the controls (p < 0.001). The results in B represent the mean ± standard error obtained from 6 experiments. Scale bar: 100 μm. ADAMTS-1 knockdown decreased the velocity of MCF7 cells, as shown by time-lapse video microscopy. The cells were transfected with either ADAMTS-1 shRNA-GFP (treated) or non-silencing shRNA-GFP (controls). The fluorescent images were then superimposed with MCF7 cell trajectories (color tracks) and are illustrated as manual markings on the same cell at different time points (E). The cells were recorded after 4.5 hours. The treated cells (F) presented shorter trajectories over time as compared to the controls (G), and the velocity of the treated cells was lower in comparison to the controls (H). The asterisks indicate significant data in comparison to the controls (p < 0.01). The results in D represent the mean ± standard error obtained from 6 experiments. Scale bar: 100 μm.
Figure 6
Figure 6
Decreased ADAMTS-1 induced increased VEGF levels in conditioned medium from MDA-MB-231 cells (A) and tubulogenesis in HUVECs (B). ELISAs were carried out to quantify the VEGF levels in conditioned medium from MDA-MB-231 or MCF7 cells treated with siRNA targeting ADAMTS-1. MDA-MB-231 cells with reduced ADAMTS-1 expression exhibited a statistically significant increase in VEGF in conditioned medium (A, right graph). Conversely, MCF7 cells with ADAMTS-1 silenced by siRNA showed a decrease in VEGF levels in conditioned medium (A, left graph). HUVECs were grown in conditioned medium derived from MDA-MB-231 cells transfected with ADAMTS-1 siRNA. In this situation, tubulogenesis was induced after 6 hours (B, right panel). The control cells (medium from cells transfected with control siRNA) showed no particular architecture (B, left panel), whereas tube length was increased in HUVECs treated with conditioned medium derived from MDA-MB-231 cells transfected with ADAMTS-1 siRNA (C). The immunoblot shows the difference in VEGFR expression between MDA-MB-231 and MCF7 cells (D). The asterisks indicate significant data in comparison to the control (*p < 0.05; ***p<0.001). The panels in (B) represent volumetric renderings from at least 10 confocal optical sections (software Imaris 7.1). The results in (C) represent the mean ± standard error of three experiments carried out at least three times. Scale bars: 50 μm.
Figure 7
Figure 7
Increased cell migration and invasion was stimulated by decreased expression of ADAMTS-1 and was partially rescued by a VEGF functional blocking antibody (A, B). ADAMTS-1 knockdown increased the migration and invasion of MDA-MB-231 cells. The migration of MDA-MB-231 cells with ADAMTS-1 silenced by siRNA increased two-fold as compared to the control. The addition of an anti-VEGF blocking antibody partially rescued this migration to control levels (A). Invasion assays were carried out in Boyden chambers coated with Matrigel (B). Cells with silenced ADAMTS-1 demonstrated three-fold increased levels of invasion as compared to the controls. Invasion was partially rescued to control levels in cells pretreated with the VEGF blocking antibody. The asterisks indicate significant data (*p < 0.05, **p < 0.01, ***p < 0.001). The results represent the mean ± standard error of three experiments carried out at least three times.
Figure 8
Figure 8
ADAMTS-1 knockdown increased invadopodia formation in MDA-MB-231 cells. Cells were grown on gelatin-Alexa-567 for 6 hours. Image A is a merged image of the blue (nuclei stained with DAPI), red (gelatin-Alexa 567) and green (ADAMTS-1 shRNA-GFP) channels. Z-projections of 10 optical sections together with orthogonal projections onto XZ (top) and YZ (left) planes were generated (B). The white lines in (B) indicate points of the XY image projected to generate orthogonal (perpendicular) XZ (top) and YZ (right) planes. Orthogonal projections of XZ and YZ illustrate digestion at the ventral surfaces of cells. Substrate digestion could be clearly observed when planes XY, XZ and YZ were viewed in the same volume (C and D, arrowhead). Images C and D were rotated to observe the cell’s ventral surface. The control samples (treated with non-silencing shRNA-GFP) show discrete matrix digestion (E and F). The area measurements demonstrate that ADAMTS-1 knockdown significantly increased matrix digestion (G). Digested areas in close proximity to the cell ventral surfaces indicate that ADAMTS-1 knockdown induced invadopodia activity. The asterisks indicate significant data in comparison to the control (*p < 0.05, ***p < 0.001). A total of 10 random fields were imaged per experimental group. Scale bar: 10 μm.
Figure 9
Figure 9
Schematic diagram summarizing our current understanding of the role of ADAMTS-1 in breast cancer cells. In normal cells (A), the extracellular environment is enriched for ADAMTS-1. This protease sequesters VEGF, thus preventing the effects of this growth factor on migration and invasion. In contrast, tumor cells (B) exhibit lower levels of ADAMTS-1 in the extracellular matrix. In this scenario, VEGF is no longer sequestered and becomes freely available to bind VEGFR, thereby increasing the migration and invasion of breast cancer cells.

Similar articles

Cited by

References

    1. Comoglio PM, Trusolino L. Cancer: the matrix is now in control. Nat Med. 2005;11:1156–1159. doi: 10.1038/nm1105-1156. - DOI - PubMed
    1. Kleinman HK, Philp D, Hoffman MP. Role of the extracellular matrix in morphogenesis. Curr Opin Biotechnol. 2003;14:526–532. doi: 10.1016/j.copbio.2003.08.002. - DOI - PubMed
    1. Rocks N, Paulissen G, El Hour M, Quesada F, Crahay C, Gueders M, Foidart JM, Noel A, Cataldo D. Emerging roles of ADAM and ADAMTS metalloproteinases in cancer. Biochimie. 2008;90:369–379. doi: 10.1016/j.biochi.2007.08.008. - DOI - PubMed
    1. Pantel K, Brakenhoff RH. Dissecting the metastatic cascade. Nat Rev Cancer. 2004;4:448–456. doi: 10.1038/nrc1370. - DOI - PubMed
    1. Brown HM, Dunning KR, Robker RL, Pritchard M, Russell DL. Requirement for ADAMTS-1 in extracellular matrix remodeling during ovarian folliculogenesis and lymphangiogenesis. Dev Biol. 2006;300:699–709. doi: 10.1016/j.ydbio.2006.10.012. - DOI - PubMed

Publication types

MeSH terms